
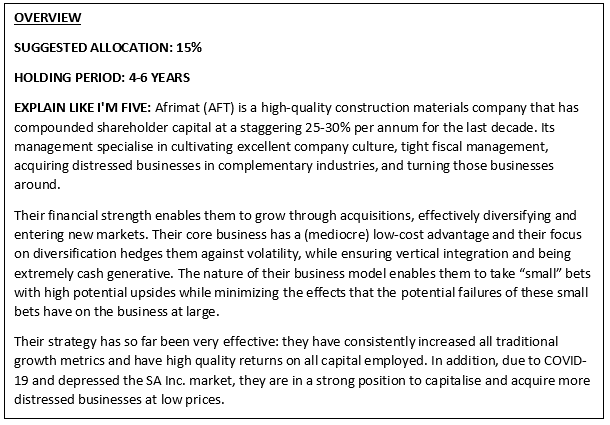
The below is an in-depth look at Afrimat (AFT). If you are interested in investing, we would strongly recommend reading the whole thing. If you are merely looking for interest sake, we suggest skimming through and reading the bits in bold. They have been written in simple English and you should be able to get the gist of the article from them.
If you are even more pressed for time, the Explain like I’m Five section in the Overview will suffice.
What is Afrimat?
Afrimat is a BEE-certified company specialising in mid-tier open pit mining. It produces industrial and construction materials (like limestone, various bricks and cement) and as of 2016, iron ore.
At the time of writing, its shares are trading at R24.8/share.
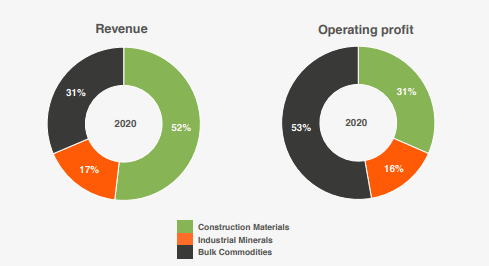
It has a broad footprint across industries (Figure 1) and South African geography (Figure 2) and has a diversified portfolio of revenue sources (Figure 3). The below figures are taken out of their August 2019 Interim Results presentation.
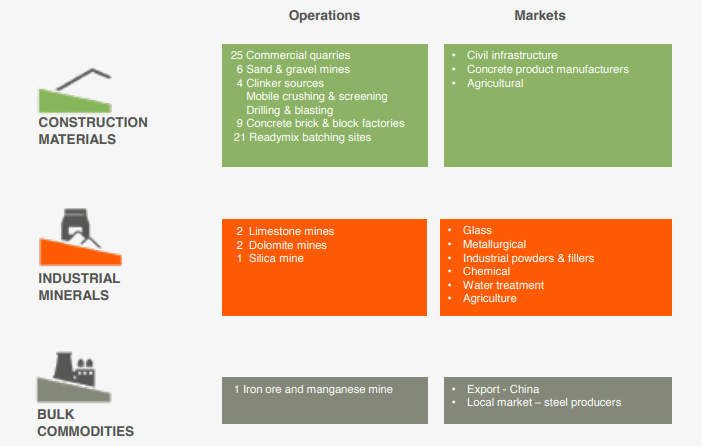

Afrimat is one of the few in its industries with integrated supply lines – their mines supply the raw materials to their concrete and cement divisions (construction materials). These products are primarily concrete blocks and bricks etc for affordable housing.
Industrial minerals constitute the mining of a variety of minerals (limestone, clinker, quartzite and metallurgical dolomite). Dolomite goes to steel industry, most of the rest goes to the construction industry and most of the lime goes to either the agricultural industry or various niche markets. While Afrimat does do some contracting work (mostly mobile hard rock crushing, drilling, and blasting) it is a much smaller part of the business.
On the commodities front, Afrimat has the iron ore mine in the Northern Cape. In recent years this has produced particularly astounding results. Worryingly, these results have compensated for rather average performance on the other fronts.
As Afrimat is in the commodities space, below is a quick guide on how commodities are priced in the real world (read: not on exchanges). From the supplier’s side, mineral based commodities need to be mined, purified, marketed, and shipped. These all need to be factored in cheaper than the pricing that competitors offer (proxy: daily iron ore price as per Plats Index), as nobody is going to buy a commodity that is uncompetitively priced. What this basically amounts to is the inclusion of shipping and logistics-to-harbour costs, on top of the quality adjustments made for the purification process, all effected by the ZAR/USD exchange rate (as marketing costs and the selling price are typically in USD).
This means that companies like Afrimat are usually very subject to the fluctuations of a variety of factors. Any mitigation of these factors (e.g. a mine near a harbour lowering logistics costs) is a welcome benefit. This means that Afrimat having a broad geographical footprint and diverse revenue streams both lower costs overall and mitigate the effect of fluctuations on its business cash flow.
Bear Case
Right, lets kick off with the bear case. Straight off the bat we find Afrimat a little too expensive relative to its peers in both the construction and materials industry, and those in the iron ore industry. This is a big concern for value investors like us, as the last thing we want is to overpay for a company. The counter to this is that it may be undervalued relative to its net present value on a discounted cash flow basis, or it may be an outstanding company amidst terrible ones. We shall see.
As far as the industry goes, construction is typically an awful one for investors given the commoditized nature of the business and the capital intensity it requires. In the latter case, Afrimat is vulnerable to this industry-detriment as well. All its operating areas (iron mining, construction – products, and industrial materials) require high rates of capital expenditure and over half its assets consist of Property Plant and Equipment. There is not much to suggest power over suppliers either (especially considering that they are vertically integrated and any squeeze in the supply would only damage themselves). Regarding the commoditized nature however, Afrimat has – primarily through its tight management and diversification strategy, been able to achieve incredibly high margins overall.
From an Afrimat-specific perspective, they grow their business largely through acquisition and business turnaround. Typically, acquisitional growth provides growth over the short term but organic growth proves the sustainability of the business model. We usually count acquisitional growth as a negative relative to organic growth. This is true in 99% of cases. For Afrimat however, their acquisitional growth may prove to be a massive positive rather than the negative it typically is.
Furthering the bear case, the fact that iron ore made up such a large percentage of the revenue (relative to previous years) is – while also indicative of good strategy implementation – worryingly suggestive of a weak core business (industrial minerals and construction materials). This is worsened when viewed in conjunction with an already commoditized industry and the fact that a large percentage of that increase could’ve come simply from increased iron prices as shown in Figure 4.

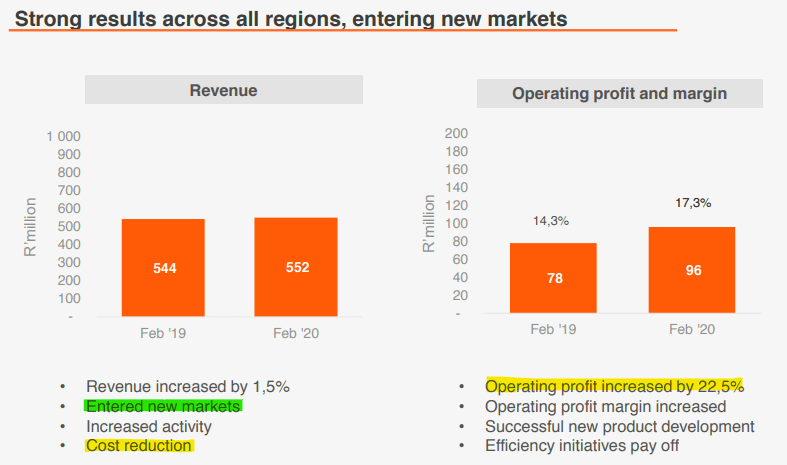
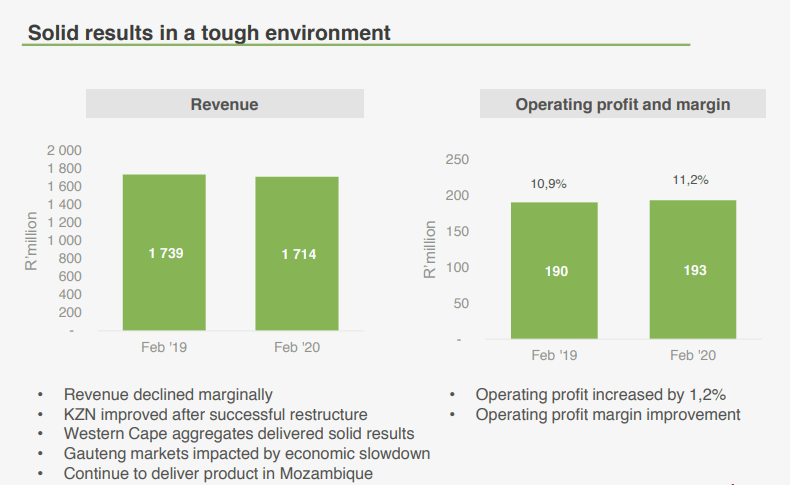
The increased growth shown by the iron ore sector of the business has largely masked the poorer performance of the core operations: The fact that they had to enter new markets only to grow revenue by 1.5% in the industrials segment is indicative of a challenging business model to operate. That said, the cost reduction implemented led to a much higher operating profit and margin, a testament to management’s capacity (see Figure 5).
Again, this is much the same in the construction materials segment in Figure 6: It seems as though improvements are marginal, only improving via cost reduction – a sphere of business that has very limited room for continued improvement.
Regarding the average performance of the construction segment of the company’s revenues, the company’s CEO, Andries van Heerden had this to say:
“This is still a major part of our business, and we think the construction sector has bottomed. Sanral [SA National Roads Agency] has started issuing a few tenders, and there are signs of green shoots. We expect construction activity to pick up in next 12 to 18 months.”
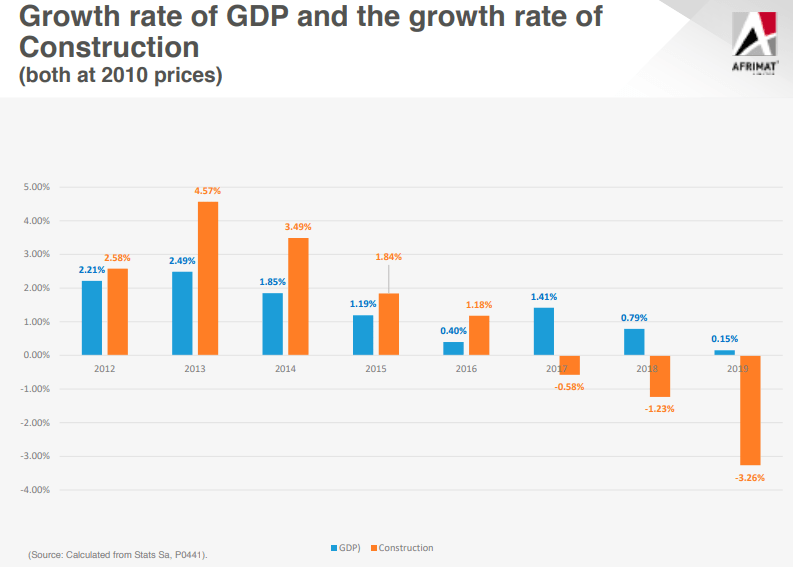
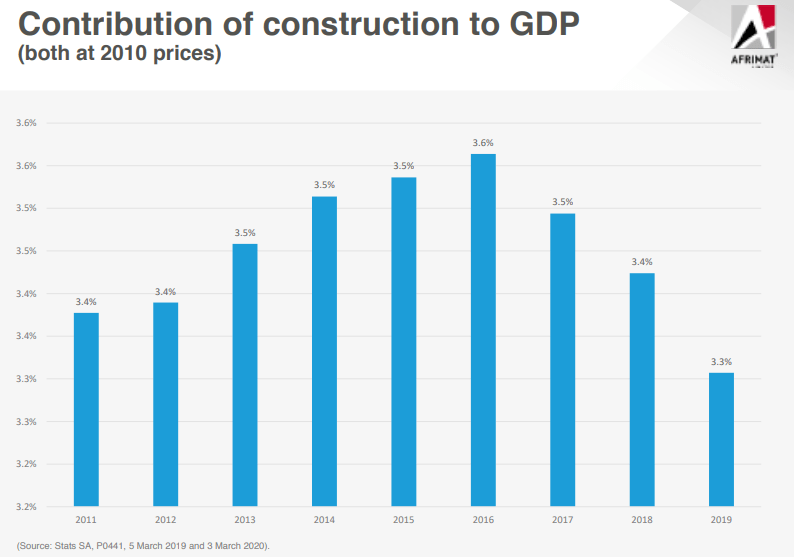
It must be noted that construction is a very cyclical industry (see Figures 7 and 8), and it appears we as South Africa are deep in the trough (somewhat exacerbated by COVID-19’s devastation on the industry). While this is appealing to Afrimat’s managers as far as picking up acquisitions at bargain prices go, it is unclear how long we will remain in a depressed state for. There is little doubt that Afrimat is well positioned for a market pick-up, however placing bets on when such a pick-up may happen is too uncomfortably close to speculation for us.
Outside of the challenging industry and South Africa’s cyclical trough, it is difficult to find a reason to short Afrimat. Their acquisitional growth is admittedly not in line with our usual preferences, however in this case it may prove not just highly successful but may even act as a “moat” for their company.
Bull Case
The thing that drew us to the company originally was a press-promo story about its efforts to give one of their employees access to education. The company genuinely seem interested in growing people. Furthermore, they go out of their way to give back, spending nearly R5 million on community upliftment projects during the year. They are also BEE qualified and through their partnerships with African Rainbow Capital they can access government tenders and bids with increasingly good relationships.
Part of their company culture, in addition to investing heavily in their employees, is the fostering of an entrepreneurial culture within the business. Andries van Heerden, the CEO of Afrimat, was announced the Master winner of the 2017 EY World Entrepreneur Award™ Southern Africa. This is especially important, as the company culture is one of the primary reasons we believe they make for a good investment. In 2020, R35,4 million (2019: R27,4 million) was spent on skills development, bursaries, learnerships and internships for the year. 78,4% of this expenditure was in respect of historically disadvantaged employees. According to this article, on average all employees undergo at least two developmental courses to upskill themselves.
Now, all the warm-heartedness and managerial prowess in the world does not necessarily justify the investment, particularly when the price tag is relatively high compared to its peers. In order for us to invest, Afrimat needs a very defensible moat.
To understand this moat, one needs first to understand a little about the mining sector and the related construction or industrial material sectors that Afrimat operates in. While they are some of the industries that the African continent is built on (the sale of raw materials specifically), they are also commodity-driven industries. The combination of these two factors mean that mining and materials companies in South Africa face very stiff competition (which we will dig into at a later stage).
All businesses in Afrimat’s sectors have little to no pricing power given the commoditized nature of the business. Thus, any moat in these businesses must come from another, non-pricing-power-related area. In Afrimat’s case, it is their excellent management and diversification strategy. As it stands, the diversification strategy has paid off for Afrimat, allowing them the strong balance sheet and liquidity to acquire more minor competitors, expanding their reach within Africa while the rest of the industry struggles.
The company’s management seems to be incredibly good at allocating capital as evidenced by the success of their past acquisitions. One story that particularly impressed us is their rescinding of the acquisition of Universal Coal PLC. They initially believed it to be a promising addition, but upon further due diligence found that the price tag was a little too high for their liking, with CEO Andries van Heerden saying the following: “We are conducting some cash flow analysis. It is proving more complicated than we first thought. We actually walk away from 95% of the transactions that we target,” said Van Heerden at the time. “The aim is that we’d like to make our money back in about four years,” said Van Heerden of the Universal Coal bid. He liked the fact that a lot of Universal Coal’s production was annuity Eskom income with about a fifth of total output heading for the export market.
This is indicative not of an acquisition-hungry, grow-at-all-costs CEO concerned only with the share price, but rather of a stayed and cautious capital allocator concerned with maximising true shareholder value. They proudly display Figure 9 at all investor presentations, and justly show. If their predictions around the reality without acquisitions is correct, this is a very impressive strategic payoff.
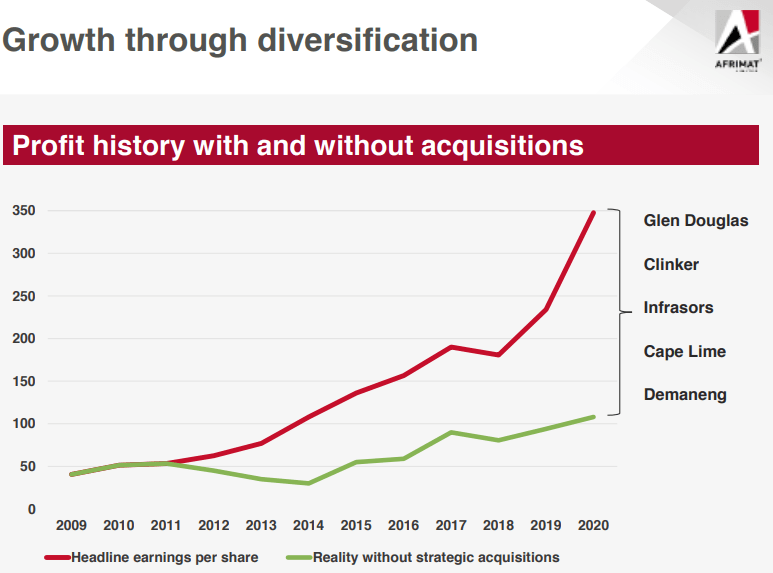
Afrimat’s strategy here seems to be buying distressed companies (Such as Demaneng and Infrasors), in industries that they are intimately familiar with, and then overhauling those companies through implementing the well-developed “Afrimat culture”. This mitigates lots of the downside for acquisitional growth (such as cultural misfits, inhibited economies of scale and conflicting operating models).
This culture includes an enterprising spirit, meticulous fiscal discipline, very conservative use of debt and an employee cultivation that results in strong bonds within the company and a very low turnover rate. This gives the company a high level of operational efficiency, effectively turning distressed businesses into competitive engines.
In Mohnish Pabrai’s book Mosaic: Perspectives on Investing, he outlines the business model of Cisco – an American multinational tech conglomerate. This model essentially consisted of using it’s “fat pipe” – the sales and service infrastructure it had to its customers – and an aggressive acquisition policy to buy up smaller competitors and pump their products through its pipeline. Such a pipe is enormously expensive and time-consuming to build, maintain and grow. Thus, these acquisitions benefitted the smaller competitors who saw a massive jump in their sales. They also benefitted Cisco, who paid very cheap prices for competitors whose IPOs would have fetched extremely high valuations, all the while taking out competitors and effectively buying “insurance policies” against the disruption that tech companies are so prone to.
In Afrimat’s case, they have a diverse client base which acts as risk hedge and exposes them to the full range of construction and related spend in its target regions. This – while not to the same extent as Cisco’s – is a veritable “fat pipe”. Their acquisitions are not so much an insurance against future disruption, as mining is not really a “fast changing” industry like tech, but a rather a hedge against fluctuations in the prices of underlying commodities.
The fact that they buy businesses at low prices means they can take “small” bets with high potential upsides while minimizing the effects that the potential failures of these small bets have on the business at large. Further, their company culture ensures the businesses they take over have a very high chance of succeeding. The combination of these stacks the odds in their favour.
As we shall see below, this strategy has so far allowed Afrimat to outperform all competitors by a very large margin in the industrials and construction sectors, and has allowed them stability and smoothness of income in the iron ore industry – a sector dominated by the volatility of the underlying price of iron. Thus, they get the leveraged upside of the iron industry and are carried by their other industries when iron underperforms. Further, their exports of iron offer access to USD, a hedge against the ZAR, and offer very high margins throughout the cycle (as can be seen in the margins of its iron ore competitors).
A final benefit of this strategy is that it has enabled Afrimat to position itself with a broad geographic footprint (decreasing the cost of transporting goods to customers), unique metallurgy (allowing it access to niche markets with less competition and higher barriers to entry) and – because it buys businesses for significantly less than they are worth when turned around – a distinct structural cost advantage.
One last note on mining stocks: They typically offer leverage to commodity prices. In Afrimat’s case, lets assume they mine iron ore for a cost of $63 and the price of iron is $90/tonne (calculated using the current approximate price of iron ore and Afrimat’s COGS-to-Revenue of 0.69). The net present value of their Demaneng mine would be based on that $27 margin. If the iron price increased by 20% to $108, then the net present value of the mine would nearly double as the margin would increase to $45. Thus, the value of the mine increased five times more than the increase in the gold price. Most people buy mining stocks because of this leverage. While this may be a negative should commodity price plummet, Afrimat’s diversification strategy hedges it strongly against such leveraged downside.
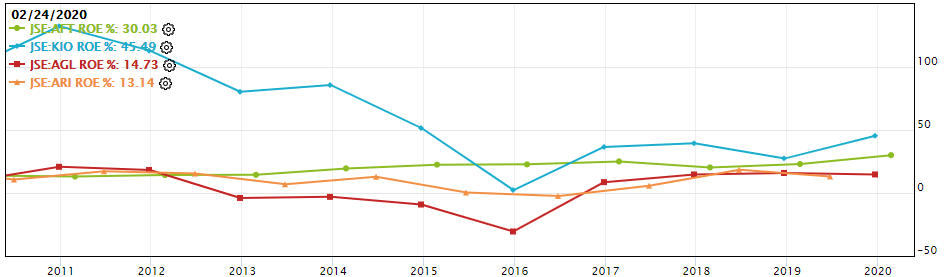
If you are not yet satisfied with the benefit of Afrimat’s strategy, let’s take a look at its historical performance over the past decade:
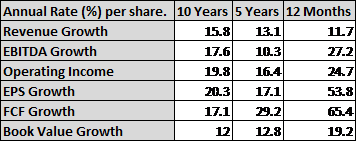
You will note that in the last 12 months their performance was outstanding. This was because of the outperformance of their iron ore segment, largely due to the massive uptick in iron ore prices mentioned above. While such outperformance would typically have inflated the share price, the recent events of COVID-19 on the mining industry have brought the shares well into our buying range.
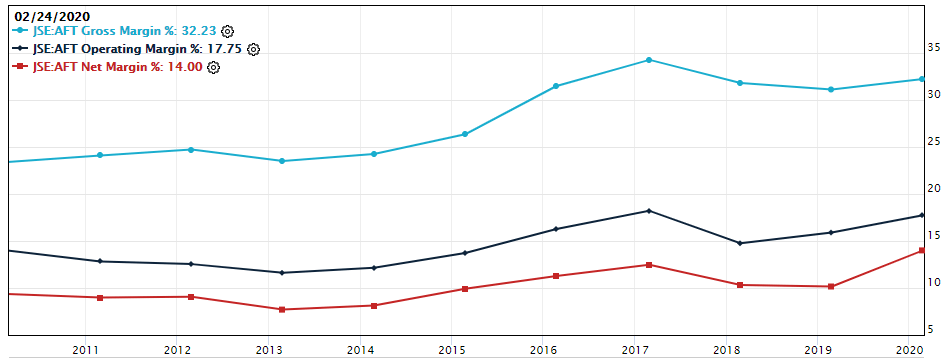
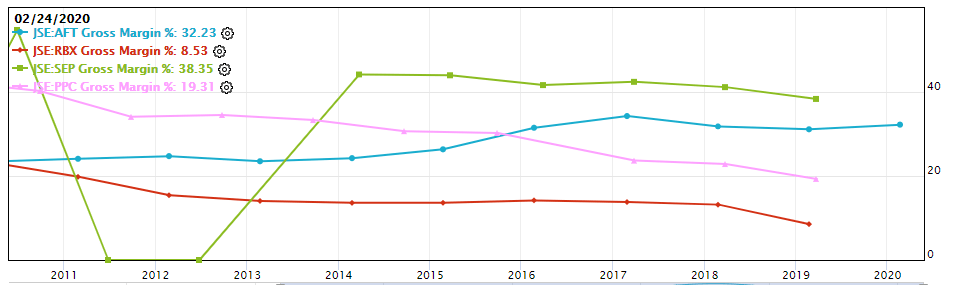
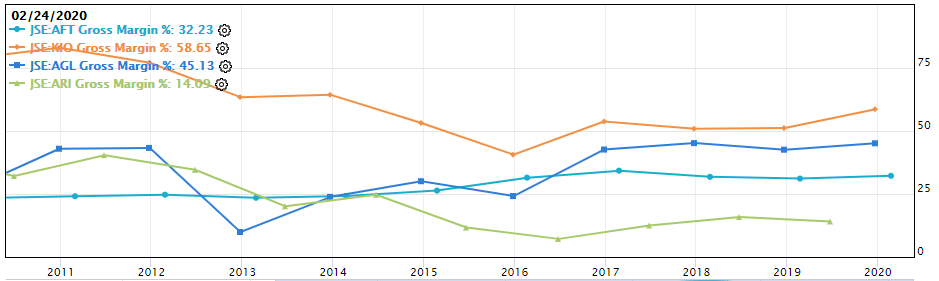
The company has also increased margins (cf. Figure 11) superbly over the last decade – another testament to their diversification strategy (which began in 2009).
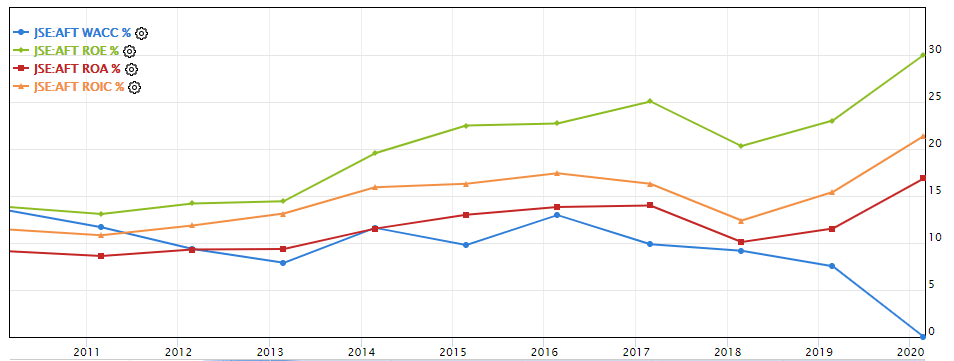
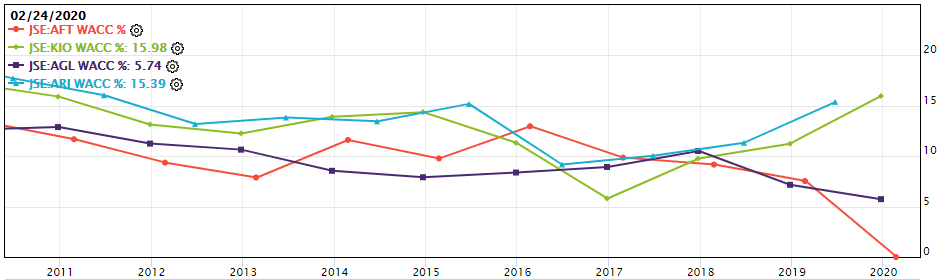
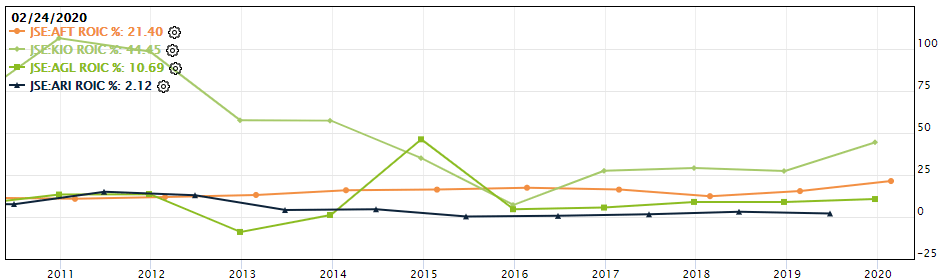
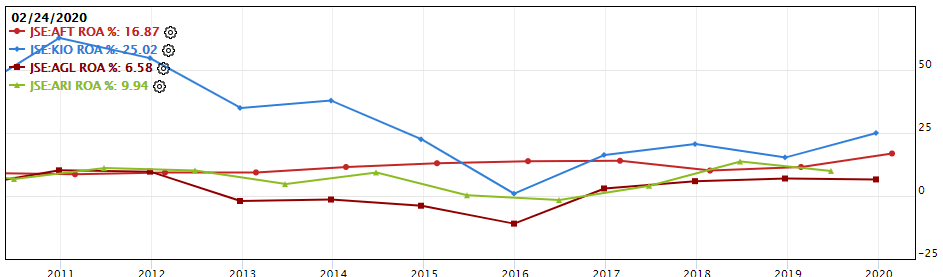
Further, the company has quietly been increasing returns on capital, equity and assets employed, as well as with decreasing its cost of capital.
This incredible performance has caused all major metrics per share to increase steadily alongside the company’s share price over the past decade.
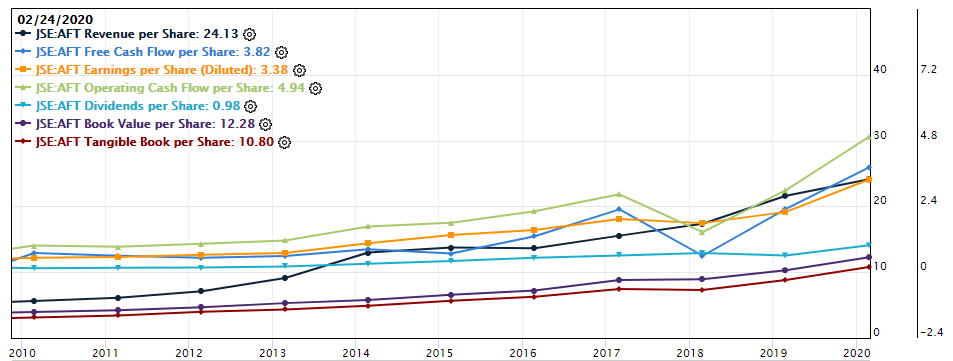
We at SA Equities are very debt-cautious (as evidenced by our portfolio favouring very conservatively leveraged companies). As such, we particularly enjoyed it when the management of Afrimat used the increased profits from 2017 to pay off the debt they used to fund the purchase of the Demaneng iron ore mine rather than redistribute it to shareholders via dividends or for further expansion. This debt payoff explains the dip in free cash flow per share experienced in 2018.
Some quick stats about Afrimat’s current performance:
- Net cash from operations is sitting up 64.9% from 2019; Net Cash has a CAGR of 20.56% since 2016.
- The debt-to-equity ratio1 is 8.2% (down from 23.8% in 2019);
- Operating profit has grown across all business segments (see Figures 2 and 3; with bulk commodities increasing by 59.8%).
Combine these with the performance metrics in Figures 11, 12 and 13 and you will see that the company is undeniably high quality. It shows exceptional cash generation, strong quality of earnings, and increasing margins in a very tough industry.
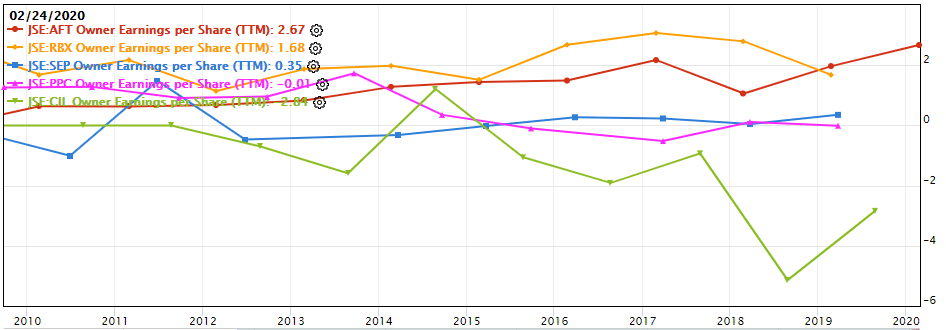
Afrimat have progressively outperformed their biggest three competitors (RBX, SEP, PPC discussed below). While RBX appears to have higher Owner EPS in Figure 14, this is inclusive of several once-off events skewing the presentation slightly. Even so, Afrimat’s relative outperformance should be clear:
As a side note, two great sources for a quick and dirty trick on evaluating mining companies can be found here (a handy infographic) and here (a library of useful tools)
Industry & Competitors
Given the above it is clear that Afrimat is a very high-quality company with very strong positioning. Beyond that the fact that it has achieved a 20% CAGR over the last year – per this article – despite SA’s poor environment suggests it is well positioned to capitalise on an uptick in local trading.
However, the outlook for a local uptick in trading is questionable. We are not prepared to necessarily bank on such a thing, hence the importance of the current COVID-ridden situation that Afrimat and its competitors are in. When there is a squeeze, the weakest links break first. Afrimat- unlike several of its competitors – is a very robust link with the potential to capitalize on the break of its minor, less robust cousins. Whether the industry improves or worsens, Afrimat is likely to be better off than those around it.
With that said, it is no good buying distressed businesses at cheap prices if those businesses are bound to never again turn a profit. For that reason, an overview of the industry and its prospects is necessary. The below is a brief summary of the report “Wholesale and Retail Trade in Construction Materials in South Africa”.
- Wholesale and Retail Trade in Construction Materials: Building materials are a key input for residential and commercial building, as well as large civil engineering projects. The construction materials trade, with sales nearing R200bn in 2019, employs over 45,000 people and has important linkages with downstream mining and manufacturing. Players face rising competition and an increasingly challenging trading environment due to low economic growth and the decline of the construction sector.
- Building and Construction Decline: The trade in construction materials has been affected by South Africa’s prolonged economic stagnation and the ongoing weakness in the building and construction sectors. Several construction companies have applied for business rescue since 2018, including Basil Read (BSR), the Liviero Group, Esor Construction, and Group Five (GRF). Confidence among materials distributors, building contractors, and construction companies reached record lows in 2019 as building activity, and demand for key building materials such as cement, continued to decline.
- Earnings Pressure: Revenue in the retail and hardware segments of the market has been affected by constrained consumer spending, while increasing costs have eroded profit margins, particularly among manufacturers. Import competition, particularly for cement and steel products, is also on the rise.
Building materials retailers have described their operating environment as very challenging and their revenue growth, which averaged over 10% in 2016, has declined markedly in the past two years. Operating margins are under pressure and organic growth at existing stores has fallen due to reduced contractor demand, low building activity, and constrained consumer spending.
Demaneng and the Iron Outlook
We have spoken briefly about Afrimat’s Demaneng iron ore mine in the Northern Cape, and at length about the outperformance of their iron ore business. While not quite an investment thesis on its own, it happens to be particularly important when evaluating Afrimat. Enough so in fact, that it warrants an entire segment discussing it in this little company analysis.
In essence, the value of a mine is the sum of the discounted future cash flows it will have for the business for as long as the mine is alive. This differs from a business discount cash flow analysis as, in theory, businesses continue in perpetuity, while mines have a limited life span. This lifespan can be improved as more mineral deposits are found; however, over-anticipating deposit discovery is a fool’s game. We prefer to be more conservative in our approach.
Running a very brief DCF for Demaneng, using a COGS-to-Revenue of 0.69, a net margin that is half of gross margin, iron ore prices ranging from $50 to $90/tonne, a discount rate of 15% and varying the annual tonnage output between the given 1 million tonnes and a more conservative 750 000 tonnes leaves you with an approximate net present value of between $75 million and $181 million (between R1.3 billion and R3.1 billion).
In 2019, Afrimat released the below figure (Figure 15) on their Demaneng mine.
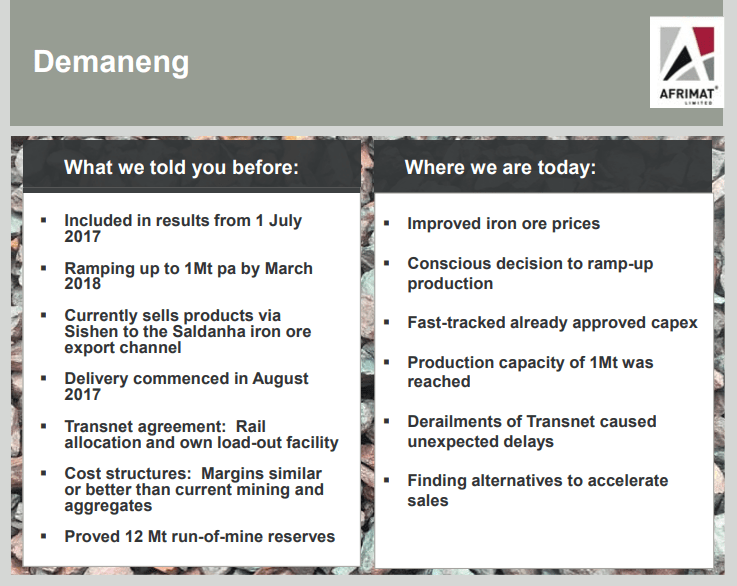
In short, Afrimat turned Demaneng – a failing mine with poor management – into a roaring success through strong operational excellence. This is a very good article on the turnaround. While we don’t think they will necessarily do it again, it is a testament to their strategy. Even better for us, there is a lot of the mine left.
As an aside, in 2017 (the purchase and recovery year) Demaneng made a loss, damaging AFT’s overall performance then. However, due to their diversification, this loss was not too damaging to the business’ performance. This is dhandho in action. Heads I win, tails I don’t lose much.
The Northern Cape, as far as iron mines go, produces some of the highest quality iron with the lowest rates of contaminant. Thus, on the topic of demand for Demaneng’s iron, Andreis van Heerden (CEO) says they can sell every ton they want to domestically into the SA market (which is sized at eight million tons per year). However, they believe their product is superior quality and accordingly prefer to receive US dollars for it.
Regarding the potential for future growth in iron mining, Afrimat is still in a very good space, is highly cash generative and has a strong balance sheet, even though debt levels have moved up somewhat following the acquisition of Demaneng. Van Heerden points out that certain international mining players are waiting to exit and that opportunities to acquire those businesses exist:
“We are in a buyer’s market,” he says, “We are looking to acquire more iron ore deposits in the area around the Demaneng project in order to bolster the life of mine to beyond 20 years. When we acquired the operation, it had a life of mine of just five years – we have since doubled the life of mine and are now looking at increasing it beyond 20 years.”
Andries van Heerden, CEO of Afrimat
Regarding their other mines:
- Glen Douglas, the dolomite, aggregates and lime operation in the Vaal area, turned in a good performance, especially when viewed against a relatively weak demand scenario. Notably, this mine has a rail sliding equipped – which means they can undercut competitor pricing through decreased transport costs.
- Cape Lime, which Afrimat believes is the best quality limestone mine in SA, has a very long life and turned in a reasonable performance.
- “A limestone mine may become more valuable than a platinum mine”, says Van Heerden, alluding to the fact that while limestone may be less glamorous than platinum, it currently has better intrinsic demand characteristics.
Regarding iron ore, Afrimat is a junior miner competing with majors in the SA market & globally. Here is a short article on what it means to be a junior or a major miner, but to summarize: majors are old money with large operations and slow, steady cash flow. Juniors tend to have little capital, short histories, and high hopes for huge returns. For the juniors, there are three possible fates.
- Most common is a failure, which leaves a hole in everyone’s pocket, including that of the banks and investors.
- The second fate occurs when a junior has enough success to justify a major paying a decent premium to gobble it up, leading to decent returns all around.
- In the third and most rare fate, a junior finds a large deposit of a mineral that the market wants a lot of – it is a magical combination of the right deposit at the right time. When this happens, juniors can return more in a few days than a major will return in years.
Now, another one of Afrimat’s winning features is that – because of its core industrial and construction materials business – it suffers little of the go-for-broke risk that typically faces junior miners. While an overestimation of reserves or a bad investment call can still damage Afrimat’s returns, their managerial prudence and the steady income from established businesses means they are a little less fragile then regular juniors.
From an industry perspective, The effect of covid on iron ore is uncertain as countries – post the current fiscal stimulus– will likely be consolidating balance sheets and governments will not be as bullish on fiscal expansion by way of construction projects. Despite this, SA has committed to increasing construction sector which is good for Afrimat. All of this is rather speculative however and is not an area we are willing to base much of a judgement on.
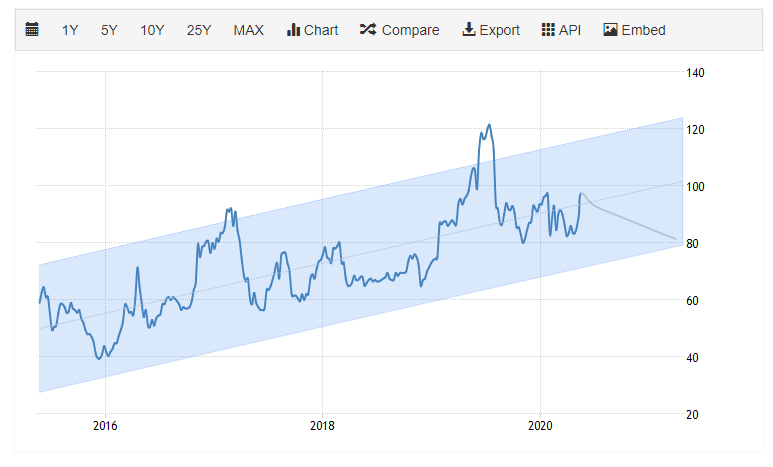
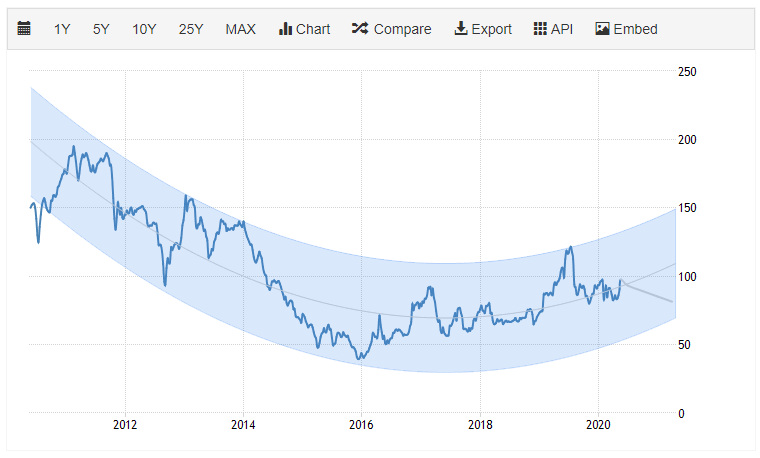
Iron ore seems to be coming out of the low end of a cycle in pricing. Forecasts have it as “increasing” to between 80 and 120 over the next while (Figures 16 and 17). This is subject to shocks (such as china’s iron ore shock or Vale’s bursting dam that created a serious deficit in iron ore) and is a little bit of a decrease from the highs of 120 that AFT experienced earlier this year. Nevertheless, Demaneng looks well positioned to produce lots of iron ore for a long time while the prices in iron ore suggest a conservative uptick.
Fitch expects iron ore to average $90/t in 2021 and $85/t in 2022. This is aligned to its revised forecasts for China’s real gross domestic profit growth and construction industry value growth to accelerate in 2021 following a weak 2020. This is countered with a low of $70/t to even $50/t during 2020. These are not optimistic outlooks for Afrimat, which will be under pressure to try top its performance last year.
All in all, Afrimat timed its entry into the iron ore business two years ago perfectly, riding the surge in iron ore prices which are up 40% since the start of this 2019. Prices hit a five-year high of US$120 per ton towards the end of 2019, helped by strong demand from China and a deadly dam disaster in Brazil, which reduced output from the world’s largest producer, Vale. This perfect entry we attribute partially to luck, and partially to management’s skill to capitalise on the turnaround of a distressed mine. While the management may be entirely capable of repeating this feat going forward, we would prefer to conservatively assume they will not.
Going forward, Afrimat’s CFO, Pieter de Wit, believes they will continue to diversify – possibly with a move into coal mining. He hopes to shield the company even further from the languishing construction sector. The Clinker business (under the construction segment) has legs for around 2-3 more years – although management is trying to expand this.
Interestingly – as Figure 18 below shows – the diversification strategy Afrimat has employed has been incredibly beneficial so far. The deteriorating JSE Construction and Industrials Index (in blue) is compared to Afrimat’s share price (in orange).
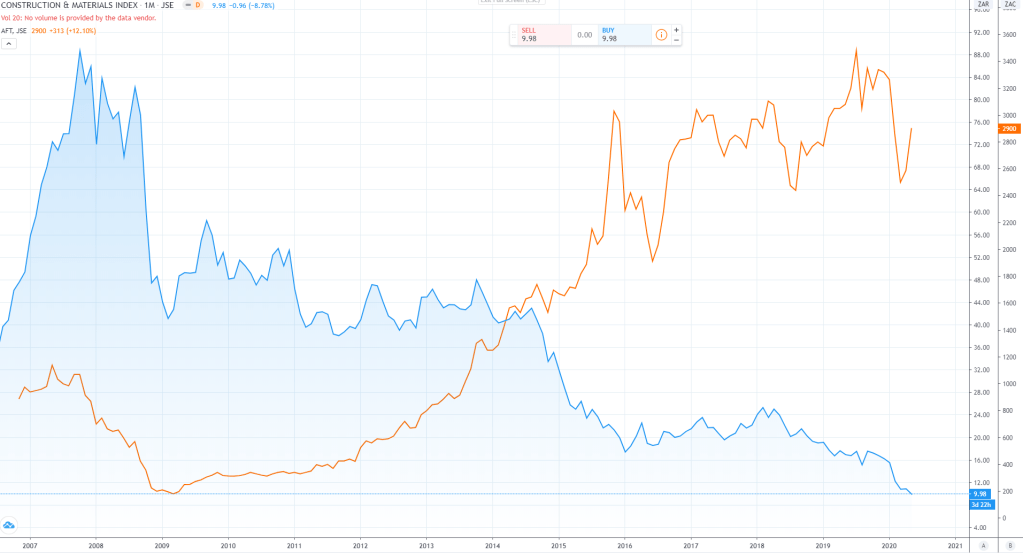
Below, in the similar Figure 19, is AFT and the SA Mining index.
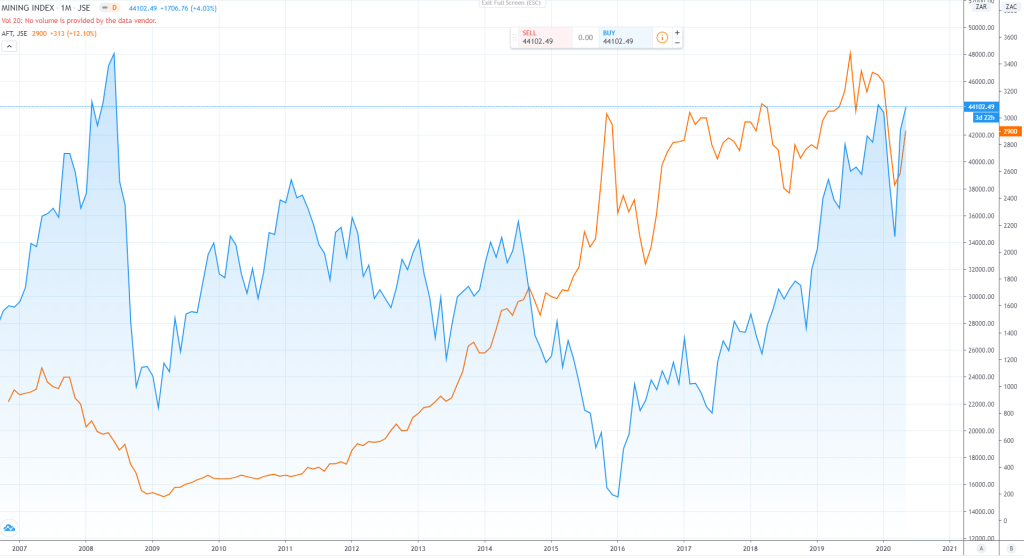
In both cases, AFT has performed outstandingly, however in recent years the mining index has largely been spurred by the increased platinum, palladium and iron ore prices that South African majors have produced. It is interesting to note how Afrimat mirrored the increase in the mining at around the same time as they entered the iron ore market (and at about the same time the Construction index began performing so poorly).
Major Competition
While one tonne of iron ore is pretty much identical to another, and all industry-specific companies face the same industry-specific headwinds and tailwinds, that does not at all mean that one mining company is like another.
As mentioned several times, when dealing with commodity-oriented companies, their product pricing power is virtually nil. They must have other moats. Hence, we look at industry comparative performance measures. Note however, Afrimat’s measures – given the different industries it operates in – will skew the results relative to those industry specific companies it is being compared against.
It is for these reasons why comparing Afrimat’s performance and price relative to its competitors is so vital in determining the worthiness of it as an investment. We have divided Afrimat’s competitors into three core groups. The first is their competitors in the iron ore space – all majors, all well established. The second is their primary competitors in the construction and industrial materials space, and the third is a group of companies who they are not directly competing with right now but may compete with eventually should they continue their diversification strategy.
Iron Ore:
- Kumba Iron Ore (KIO). Mines predominantly iron ore
- African Rainbow Minerals (ARI). Diversified miner.
- Anglo American (AGL). Diversified miner.
Construction and Industrial Materials:
Primary Competitors
- Raubex Group (RBX) are one of Afrimat’s biggest competitors. They operate in virtually identical spaces for industrials and construction materials. They do not however compete in the iron ore sector.
- Sephaku Holdings (SEP) and PPC Limited (PPC) are direct competitors in the cement and construction sphere, however both have a more retail focus than Afrimat, which sells construction materials directly to large players (e.g. those in the government low cost housing sector). This is assisted by Afrimat’s BEE status and ties with African Rainbow Capital.
- WG Wearne (WEA) Wearne’s products and services include aggregates, ready mix concrete as well as mobile crushing and screening services. They are a direct competitor in terms of products but have a market cap 500x smaller than Afrimat’s.
- Aveng (AEG) is a small and globally diversified mining and construction business with no more than 28% of its business in South Africa. Thus, their level of threat is relatively minor for Afrimat. As an aside, this is an interesting company to look at – it is priced for failure but as its recent performance and geographic diversity suggest it is unlikely to approach the level of failure expected.
- Insimbi Industrial (ISB) is a broadly diversified commodity company, primarily producing alloys to the steel, aluminium, cement, and foundry industries. While not a direct competitor to Afrimat’s end products, they do compete along the value chain. Like ISB, the Mazor Group (MZR) are also a construction materials company; however, they specialize in glass and aluminium products – out of scope for Afrimat presently.
Secondary Competitors
- Invicta Holdings (IVTP) is an engineering consumables and plastic pipe company. It is a distributor thing like bearings, belts, tools, electric motors, and hydraulics. It is like the larger, consumer related Hudaco Industries Ltd. (HDC). Neither of these operate in a similar space to Afrimat.
- Argent Industrial (ART) and Arcelormittal (ACL) are steel manufacturing businesses. They also do not operate in Afrimat’s sphere currently. As an aside, the interested reader should look at both of these companies as they are trading at prices so undervalued relative the difficulties they are facing.
- Brikor (BIK) is a manufacturer of clay bricks, roof tiles and clay pipes. They will only be a competitor in the instance of Afrimat diversifying into the clay market.
- JSE:CIL/JSE:WBO (Afrimat does not compete with WBO/CIL because it does not build or construct anything actually, it just supplies the products). However, like these two, Afrimat is still subject to lack of pricing power.2
Now that you know some of the competitors, the following is basically a bunch of graphs outlining the relative pricing and performance of the three primary competitors (RBX, SEP, PPC) in its construction and industrials business.
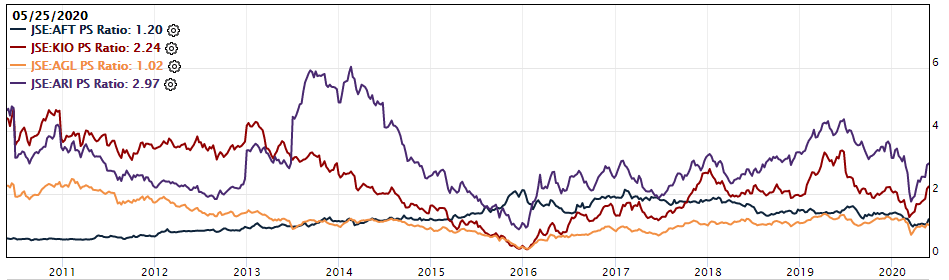
Relative Pricing (Construction and Industrials)
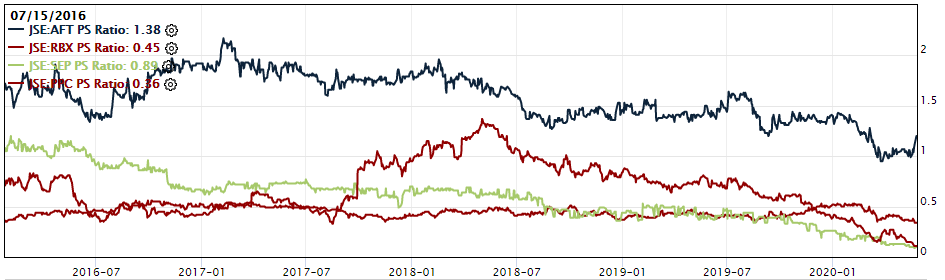
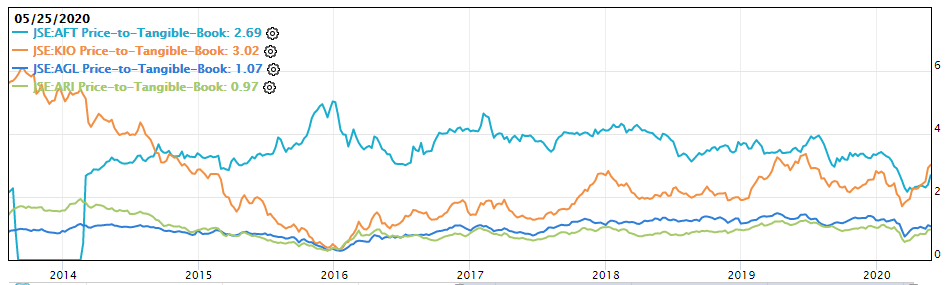
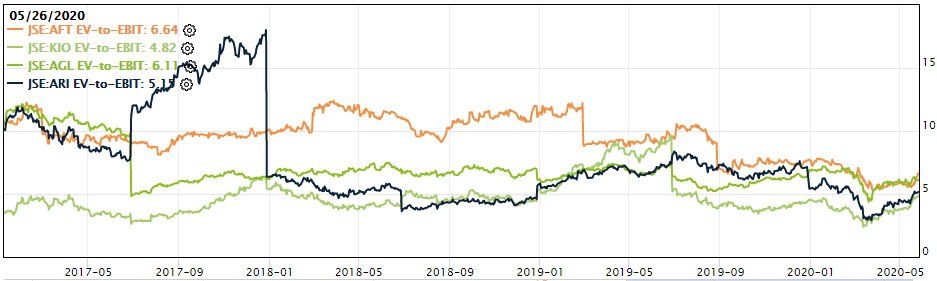
As can be seen from the below graphs, per the PS Ratio and PB Ratio, Afrimat is not cheap. In fact, it is more expensive than its peers, however, according to Free Cash Flow and the EV-to-EBIT metrics (which are more indicative of true value in our view as they factor more for performance), Afrimat is cheaper than, or at most equitable to its peers.
- Price to Sales
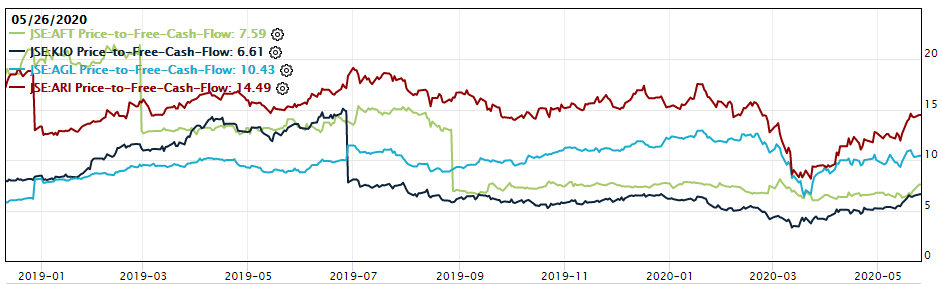
- Price to Free Cash Flow

- Price to Tangible Book

- EV-to-EBIT

Relative Performance (Construction and Industrials)
As far as relative performance goes, this is where Afrimat absolutely smashes its peers. In almost all cases it outperforms or performs near the top of its peer bracket.
Before we dive into the relative performance however, here are some of Afrimat’s key metrics to bear in mind as we progress:
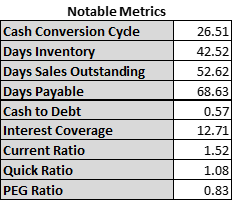
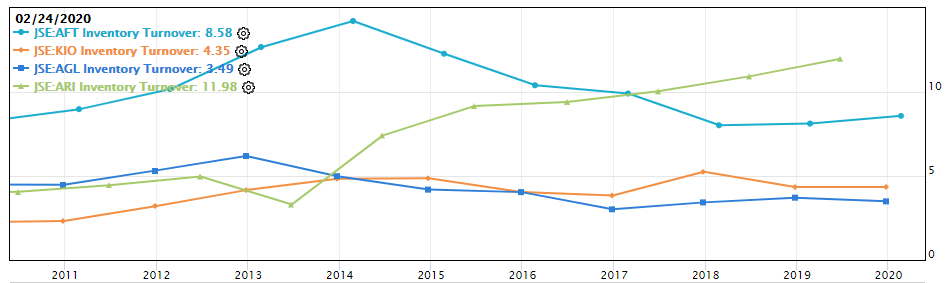
- Days in Inventory: This is a measurement of throughput. The lower the better as it suggests faster transformation from inventory to sales. Afrimat performs averagely here. This is not enough by itself to suggest a more or less efficient operation than its peers.
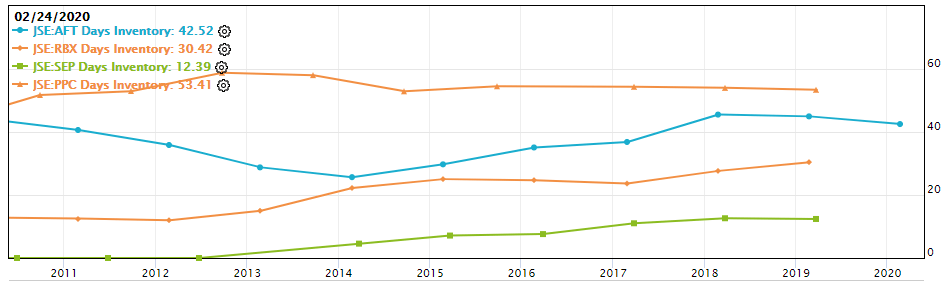
- Inventory Turnover is another measurement of throughput. Here Afrimat underperforms almost all its peers barring PPC (who notably achieved higher days in inventory above). The combination of Days in Inventory and Inventory Turnover suggest that Afrimat only decently efficient at turning inventory into revenue. This correlates with its tidy Cash Conversion cycle in Figure 20 above.

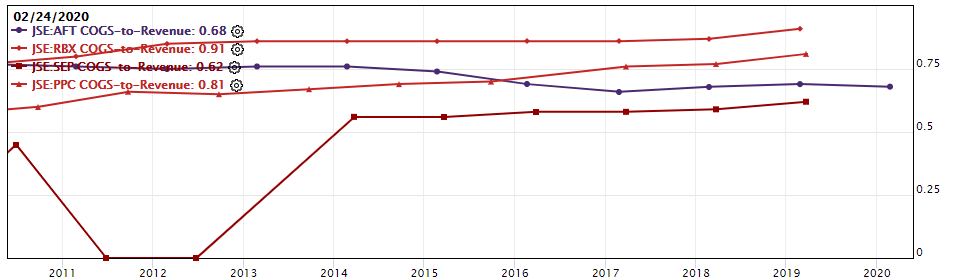
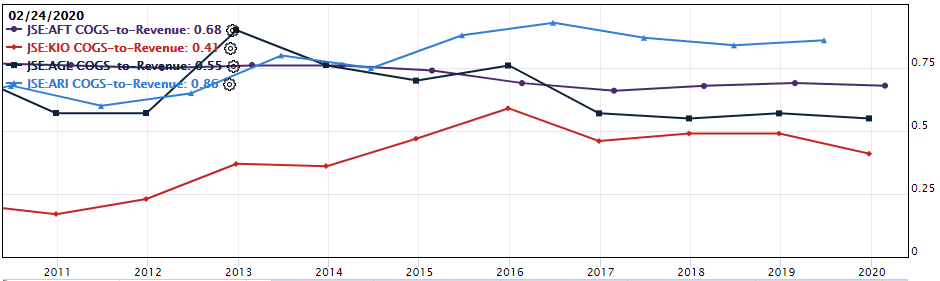
- COGS-to-Revenue. This effectively measures who is the low-cost supplier. Afrimat is quite a bit below both RBX and PPC, but SEP gives it quite a run for its money.
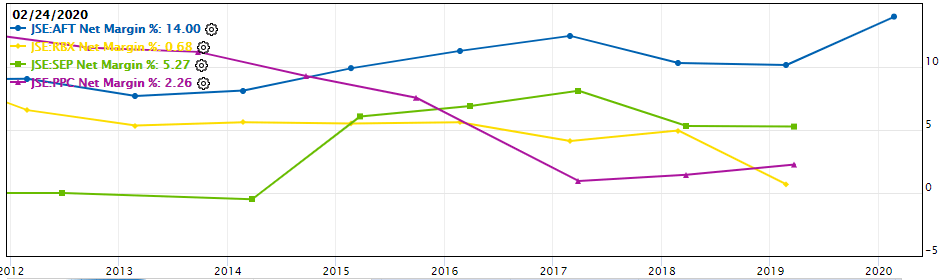
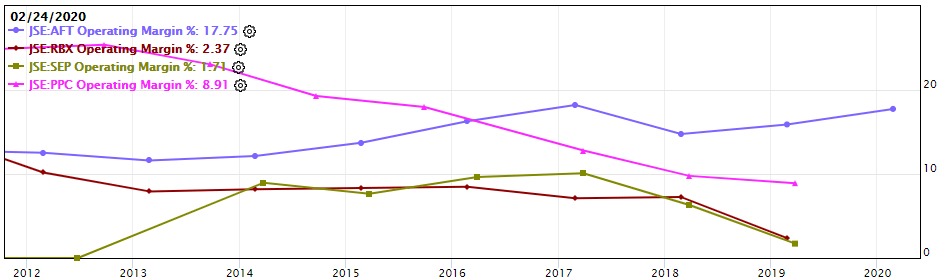
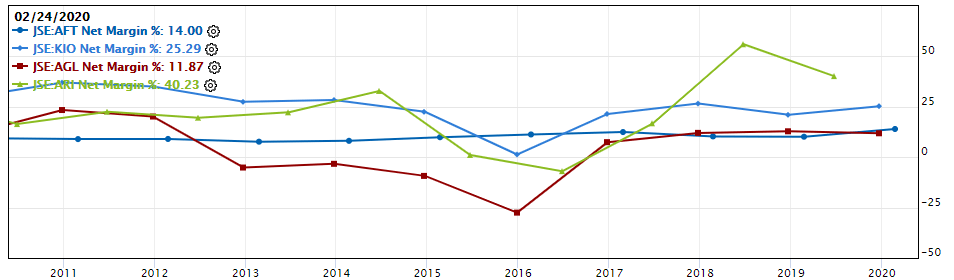
- Margins (Net, Operating and Gross respectively). The biggest takeaway here is that AFT not only has some of the best margins, but that their operating and net margins are massively better while their gross margin is only decent. This is indicative of incredible efficiency within the businesses cost framework. Note also that AFT is the only company gaining margins while the others decline. This could be due to newer markets offering higher margins, or a gain in market share. Both are equally likely.
- Weighted Average Cost of Capital. Afrimat has over the last 3 years decreased its cost of capital significantly, giving it one of the lowest costs of capital amongst its peers.

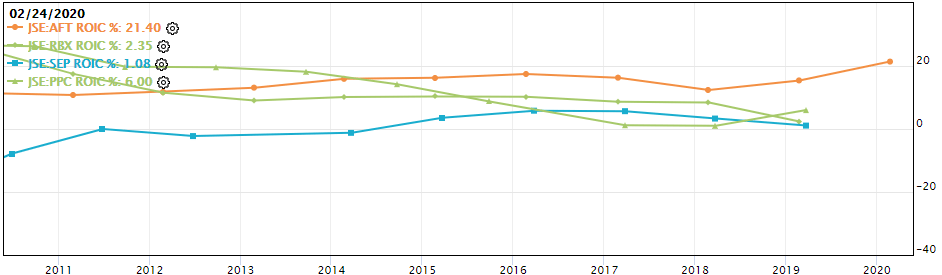
- Return on Invested Capital. Afrimat’s management have done an incredible job at allocating capital as evidenced by their consistent and vastly superior returns (21.4% to the next highest, 6%). This not only outstrips their WACC, but also means any money given to Afrimat will be compounded at exceptionally high rates.
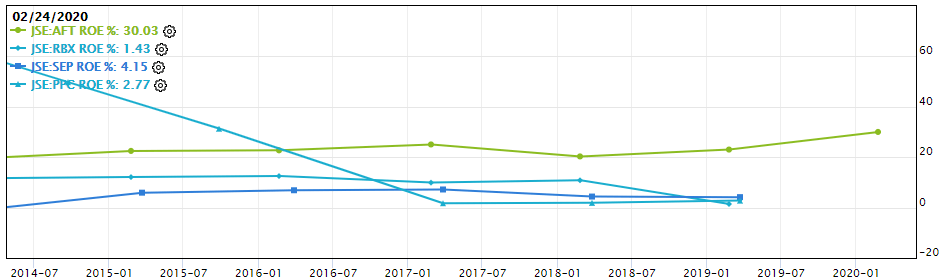
- Return on Equity. Again, Afrimat outperforms here significantly with a 30% ROE compared to the next highest, 4%.
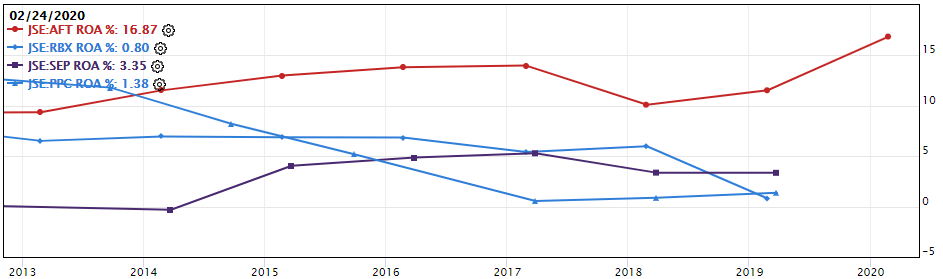
- Return on Assets. Same story as ROE and ROIC. Afrimat by a landslide.
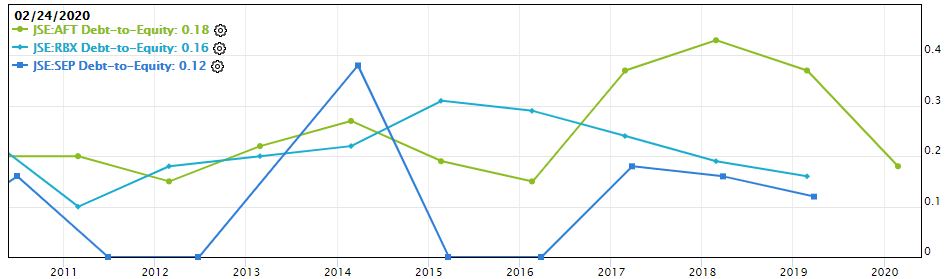
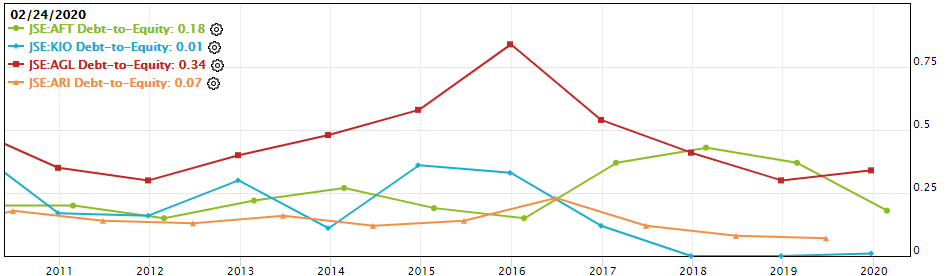
- Debt-to-Equity. We have removed PPC from the results below as their ratio was significantly higher than the competitors, skewing the results. As you can see, Afrimat have consistently kept their debt low, quickly paying debt off after the purchase of Demaneng in 2017 (which they admittedly used a lot of debt to finance).
Alright, to summarize the mass of charts above: In respect to its peers, Afrimat is not outstandingly priced. In fact it seems to be pretty averagely within their price range. The marked difference however is in the quality of Afrimat’s management (as indicated by the exceptional returns on capital achieved and the conservative use of debt), and the prowess of their business machine (they are the only company to increase already sizeable margins, and are incredibly cost efficient). In a final touch, they turn inventory to revenue and revenue to cash at decent, industry standard rates.
Relative Pricing (Iron Ore)
Now that we have examined peers in its core business, lets have a look at those in its new-ish iron ore segment. As can be seen from the below graphs, Afrimat is priced more as an iron ore company than as a construction and industrial materials company. Across the varying metrics, Afrimat averages out at around the middle in terms of valuations relative to its iron ore peers.
- Price to Tangible Book
- Price to Free Cash Flow. I have had to use only very recent values here as prior to 2019 several peer companies received ridiculously high ratios due to their cash flow being completely negligible, skewing the perception.
- EV-to-EBIT
- Price to Sales
Relative Performance (Iron Ore)
To summarize the graphs below: you will find that here Afrimat shoots the lights out a little less relative to its peers in most metrics but still delivers very impressive results in all of them. The star performer here is Kumba Iron Ore (KIO), however Afrimat’s performance is still very solid and is even more consistent than KIO. The big takeaway is Afrimat’s stability relative to other iron ore miners who are very subject to commodity price fluctuations.
- Inventory Turnover. Here, the higher the better. It is likely that Afrimat’s diversification skews its comparison here as it does more poorly on average relative to its construction material peers, but better on average than its iron ore peers.
- Days in Inventory. Combining this metric with Inventory turnover above, it is clear that Afrimat converts inventory to sales significantly faster than its competitors, again however, this may be skewed by its diversification.

- Cogs-to-revenue. Afrimat is in the upper-middle of its peer group here. This is also likely skewed by its diversification, but still suggests that it costs Afrimat more to produce a tonne of iron than it does most of its competitors.
- Margins (Net, Operating and Gross respectively). Here, a key takeaway is the consistency of Afrimat’s relative to its peers. Whereas in the prior comparison, Afrimat smashed its peers, here it is very much in the middle (suggesting that iron ore products at large have much higher, but also much more volatile margins). The massive benefit to this is that when the price of iron plummets, Afrimat is not so affected as to have its business crippled. Rather it then able to lean on the income from its other businesses while it weathers the commodity storm.

- WACC. Here, we notice that almost all iron ore miners have had decreasing costs of capital. Afrimat has also had a WACC that is in the consistently low end of its peer group (barring 2016).
- ROIC, ROA and ROE. Again, Afrimat has performed admirably, consistently increasing its return on capital and maintaining it at a very high rate. In this peer group however, KIO has outperformed (barring 2016), but has been significantly more volatile.
- Debt-to-Equity. Much more so here than with the construction and industrials group, we can see that there is a pattern in iron ore producers of leveraging to purchase a mine, and consequently deleveraging after that. This puts Afrimat’s gearing in 2017 into perspective, and again highlights their impressive conservativism.
Satisfied that Afrimat is a very high calibre company operating amongst peers who are by-and-large unable to enjoy the same consistently high returns, margins, and cash conversion cycles? If so, we can move on to an analysis of how much the company is intrinsically worth.
What are the numbers?
In the segment on Demaneng and the outlook for iron above, we ran a quick Discount Cash Flow analysis (DCF) for the Demaneng mine and arrived at a figure of between ¼ and ¾ of Afrimat’s current market cap. We have not attempted to value any more of Afrimat’s mines, as their information is hard to come by and – due to Afrimat being a blend of a mining company and a regular materials company – valuing all these mines will be of limited use in determining its true intrinsic value.
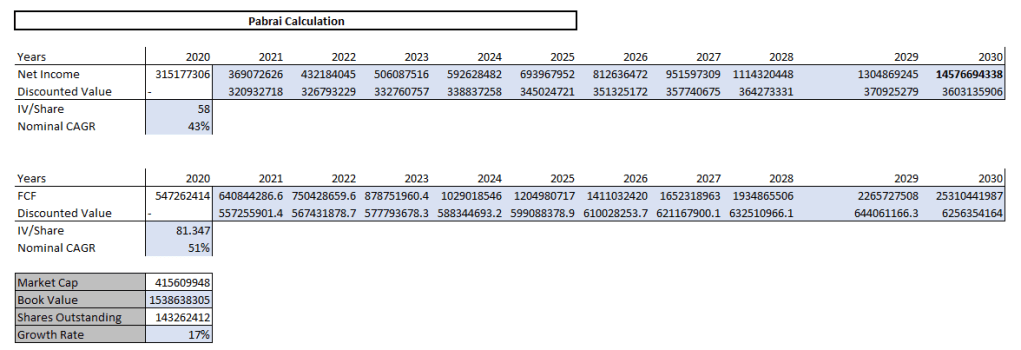
Below (Figure 21), we have applied a similar thinking to construct a back-of-the-envelope (BOE) DCF for Afrimat as a business. The DCF shown below is for the base case.
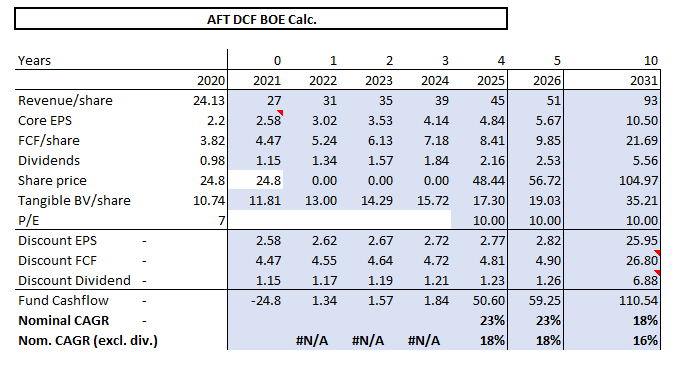
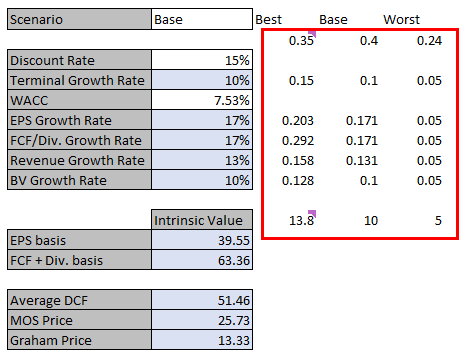
Figure 22 shows the assumptions we have used for this DCF, along with the varying probabilities afforded each case (Best: 0.35; Base: 0.4; Worst; 0.24; and Total loss: 0.01). The estimates for each factor in the DCF are shown in the red box. These correspond with the cases (as headings) they are assigned under. In essence, the best case assumes the current 10 Year CAGR for each factor, the base case assumes a conservative value around 2/3 of the current 10 Year CAGR and the worst case assumes a very conservative growth rate of 5% for all factors. This is significantly less than the 10, 5 or 1 Year CAGR for each factor. Finally, in the worst case we have factored a nil EPS/FCF and a suspended dividend for 2021 given the effect of the coronavirus pandemic.
In his book the Dhandho Investor, Mohnish Pabrai gives examples of a similar “back of the envelope” Discount Cash Flow valuation model (such as above). I have applied this below for Afrimat’s expected earnings and for its expected free cash flow and have used a conservative exit Price/Earnings multiple in 2030 of 10 in the base case (which Figure 23 uses).
It is notoriously challenging to anticipate future cash flow for any business, given the variable factors that effect it (in Afrimat’s case the price of their commodities, whether or not management can continue their current acquisition strategy effectively, and the continued functioning of existing businesses).
For this reason, we have accounted for a broad range of potential outcomes and have factored for a broad range of probabilities. We have also tried to explain throughout the paper that Afrimat’s track record speaks for itself. Through very challenging circumstances, management has allocated capital brilliantly and has executed their businesses very efficiently. We believe they will continue to do so, a fact which, combined with their diversification hedging against commodity fluctuations, makes the prediction of their future cash flow a little easier to value.
In Figure 24, we have outlined the results of our above-mentioned models run with varying probabilities and outcomes to determine the intrinsic value per share.
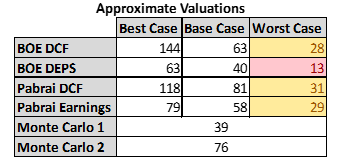
As you will see, it is only in one valuation that we are overpaying for the company (marked red) and in three where we are not buying at a very significant discount to intrinsic value.
Underneath (in Fig. 25) is one of our favourite tools in “betsizing” – the Kelly formula. In his book Fortune’s Formula, William Poundstone outlines the use of it in determining optimal portfolio amounts to “bet” on investments, given their expected return. Using this formula yields the below percentage of the portfolio to place in Afrimat.
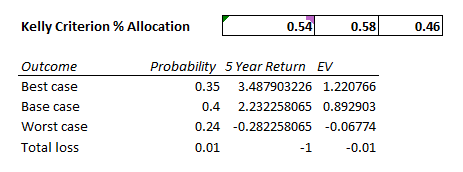
W/A – (1 – W)/B
Where W is the win probability, B is the profit in the event of a win, and A is the potential loss.
The calculations are based on the below assumptions (in line with the valuations from the DCF models above).
- Best case: Share price reaches R76.49/share in 5 years (CAGR: 38%).
- Base case: Share price reaches R48.44/share in 5 years (CAGR: 23%).
- Worst case: Share price falls to R13.37/share in 5 years (CAGR: -6%).
- Total loss: Afrimat calls bankruptcy and we get nothing.
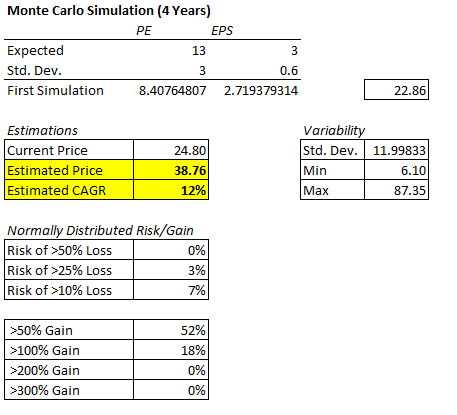
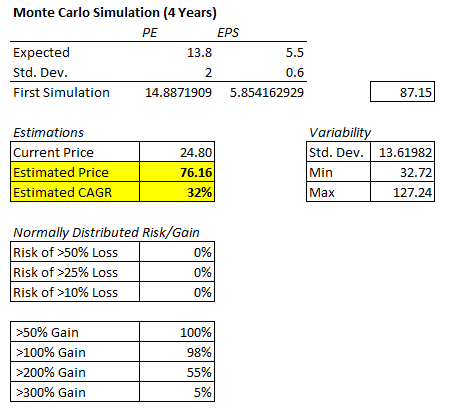
Finally, we ran two Monte Carlo simulations (Figures 26 and 27 below) to aggregate a variety of outcomes as best we could. In both cases we used an approximate PE of 13 (historical Minimum: 5.69; Medium: 13.9; Maximum: 21.66) and expected earnings after 4 years of R3/share (worst case) in Simulation 1 and R5.5/share in Simulation 2 (best case). These results highlight the lopsided risk being skewed drastically in our favour. Even in the conservative case (simulation 1), we estimate a 12% CAGR with only 7% risk of >10% loss. The most optimistic scenario yielded a 32% CAGR with a completely negligible potential for loss. This is, however, incredibly optimistic.
In conclusion, Afrimat has a high probability of outperforming in the coming years due to its superb market position and financial strength. They have a relatively predictable free cash flow stream and are currently trading way below intrinsic value on almost all valuation methods.
The Kelly Formula recommends a betsize of nearly half your portfolio, however we are more conservative and recommend a maximum of 15%.
While it is hard to estimate an exact return over the long run, our estimates are between 20-25% CAGR. This is supported by the fact that you are buying a great company, with a solid moat and a superb management team. It is backed by the lopsided risk-to-reward in the bet, and the depressed market conditions due to being a SA Inc share and currently facing the Coronavirus pandemic.
1 Including leases.
2 The reason for this is outlined nicely in Keith McLachlan’s article here.

Great article and insight! I’m glad I took the time to read it as it offered excellent insight. Three questions I have:
1. Which data did you use to calculate WACC for Afrimat?
2. In what program or on which website do you obtain the nice graphs for all the nice return and valuations vs peers?
3. Finally, do you have any more reading resources or links to further one’s knowledge of the mining and construction industry? I’d really like to understand the nature of the business and its cycles more.
LikeLike
Hi Alexander, thanks for the comment and for taking the time to read the article!
Thanks for bringing up the WACC. In the graph above it is not 100% accurate – I assume the recently released results took a while to update on the system.
WACC = E / (E + D) * Cost of Equity + D / (E + D) * Cost of Debt * (1 – Tax Rate)
1. Weights: For the market value of equity I used the market cap. For the market value of debt I used the sum of the two year average book values for both short and long term debts giving these results:
A) weight of equity = E / (E + D) = 4025.019 / (4025.019 + 406.7755) = 0.9082.
B) weight of debt = D / (E + D) = 406.7755 / (4025.019} + 406.7755) = 0.0918.
2. For the cost of equity, I used the CAPM model to calculate the required rate of return:
a. Cost of Equity = Risk-Free Rate of Return + Beta of Asset * (Expected Return of the Market – Risk-Free Rate of Return).
b. I used the SA Government 10 Year treasury constant maturity rate as the risk-free rate, at the time of the results being released it was 8.9%
c. Afrimat’s beta is 0.32.
d. I thumb-sucked a market premium of 6%.
3. For the cost of debt, I divided the most recent interest expense by the latest two-year average debt. Cost of Debt = 46.161 / 406.7755 = 11.348%.
4. The average two-year tax rate is 23.345%
5. Plugging in these figures gives you a WACC of 10.6%, not 0% as the chart suggests. Still in the lower range however.
The graphs are produced using Gurufocus and the data is a compilation of theirs taken from Afrimat’s financial reports, my own studying of the reports, and the data available for free on finbox.com.
As far as alternate links and resources go, here is a great library from which to start. I would also recommend reading the annual reports of the major miners in South Africa to get a local perspective on the industry. Beyond that, if you are interested in mining overall, Keith Mclachlan has some fantastic short pieces on local mines, you’ll have to do a bit of digging, but it’s a good place to start from an investing perspective.
LikeLiked by 1 person