
Foreword
This is the second of a long, three-part article. Here is the first. If you are interested and looking to invest into ARC, we recommend reading the whole thing. Should you be pressed for time, you can skim the bold sections and you will get the gist of it all. If your interest is merely cursory or a fleeting thought, then we would recommend the “Explain Like I’m Five” section of the summary above.
A General Note on Holding Companies
As mentioned in Part 1 of the African Rainbow Capital series, the intrinsic value of holding companies is notoriously difficult to determine. In years gone by, they have traded at ridiculous premiums to NAV and ridiculous discounts to it. Thus, even if one can accurately value the underlying assets, a large part of the market valuation of holding companies resides in Mr. Market’s mood.
However, like Buffett’s Berkshire Hathaway in the 70’s, history suggests that buying when the discount is ridiculous, the underlying assets are continuing to grow and management is continuing to find investments, is typically a pretty good thing to do.
Jean Pierre Verster, CEO of Protea Capital Management, attributes the discount holding companies face to three basic reasons:
1. The ease of asset valuation.
2. Existence of concentration risk.
3. Management’s ability to allocate capital.
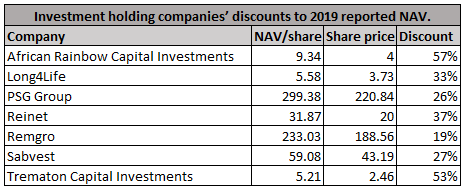
Companies such as PSG and Remgo with listed assets tend to trade at cheaper discounts as it is much easier to value their underlying assets. As most ARC’s investments are unlisted, this serves to increase the disparity between NAV and share price.
There is also the risk of being overly concentrated in a single asset, however we do not pay much attention to this risk as ARC is highly diversified and despite Rain’s large size in the portfolio believe that ARC is effectively hedged against industry or company specific risk due to their many positions. There is the possibility that several of the underlying assets underperform, however if the major holdings (Rain, TymeBank, Afrimat, Alexander Forbes and Gemcap) are quality assets then we can be comfortable with our investment.
The third reason Verster suggests for holding companies’ discounts is the market’s appreciation of management’s ability to return at rates high enough to compensate for opportunity and capital costs. To use Brait (JSE: BAT) as an example, they were trading at a premium to NAV around 2016, but a series of bad investments and high debt levels has brough the market price crashing down.
David Shapiro, deputy chairman at Sasfin Securities, believes that holding companies at large are experiencing a decrease in market enthusiasm partly due to the complexity of their business. Investors tend to prefer owning the underlying companies – “pure plays” that focus on a single business area. While we admit, this is our preference too, market sentiment is fickle, and its preferences have always been something that the savvy value investor can take advantage of.
While with many holding companies buying the underlying asset instead of the holding company may be a good idea (such as buying Firstrand (JSE: FSR) instead of Remgro (JSE: REM)) In this case, the inability to buy the underlying assets directly (as most are unlisted) renders ARC a valuable gateway as it is the only stock investors can buy should they want to get a slice of the TymeBank or Rain pie.
The market is viewing the lack of certainty around the value of the assets as a negative – holding that the uncertainty is worth pushing the price down. This is not the case – as I will outline in Part 3, the big underlying shares are actually high-quality assets positioned very well for African growth and development.
South African Holding Companies
Now, currently South African holding companies are all at a significant discount to the sum of their parts – perhaps due to the Moody’s downgrade and general pessimism towards SA Inc. shares. Perhaps exacerbated by COVID-19 or perhaps there is simply a fascination with tech stocks (which would explain the Naspers/Prosus surge of recent months) and rand hedges. While it is true that management of all companies face difficulties trading in SA at the moment given the medium term uncertainties and prolonged recession, it is also true that whatever the reason for investor’s sentiment, this sentiment creates a lot of opportunity for the wolfish.

Prominent South African economists, Viljoen and Thokan have both suggested the discounts holding companies are receiving is primarily due to market irrationality. Many of them own high quality underlying stock and, per Thokan, “And irrespective of the economic environment, we are seeing high quality companies still compounding their earnings growth above 10% and generating good free cash flow”. Note however, this is not an ARC specific comment. It is merely of interest that many SA companies are currently undervalued relative to their quality.
On the topic of SA Inc. discounts, Viljoen has said:
“When markets are very optimistic there are no discounts on these companies,” he says. “There may even be premiums. But when the market is pessimistic, those discounts widen up a lot. Sentiment is a big driver.”
Piet viljoen – south african economist
This is economese for “the market is undervaluing good companies because they expect bad performance from SA as a whole”. SA at large is facing a case of Mr. Market’s bipolarity disorder and ARC in particular is getting a whipping.
On the flipside, an undervalued asset is no protection against a shocking economic performance. This must be balanced in when risking a bet on any company. Therefore, quality is of paramount importance. Investing is fundamentally about stacking the odds in your favour: Are the odds you are offered stacking up favourably to reality?
The Mathematics of Holding Companies
Full disclosure, the credit for the below corporate finance exegesis belongs exclusively to Prof. Brian Kantor. It is summarized here briefly, but his blog post unpacks it in much greater detail.
Basically, the NAV of a company can be calculated with the below:
- NAV = ML + MU – NDt. (1)
NAV: Net Asset Value
ML: Market Value of Listed Assets – established on stock exchanges.
MU: Assumed Market Value of Unlisted Assets – usually stated by management or analysts.
NDt: Net Debt (Debt less Cash) – recorded on the balance sheet.
- MV = ML + MUm – NDt + HO + NPV (2)
MV: Market Value.
MUm: Market’s Estimate of Unlisted Assets.
HO: Head Office expenses – A negative value including management and administration fees.
NPV: Market’s estimate of the present value of management’s expected investment programme.
Thus, one can see that the larger/more active the expected investment programme and the bigger it is relative to the existing assets, the more weight it will have on the market’s valuation. NPV is usually negative when the management is not expected to be able to find investments that can compound at rates above the cost of capital. Should management be looking at investing in something that is not expected by the market to have a high yield, then the more management is looking to invest, the larger the negative value the market will assign to NPV. ARC is 95% invested already and holds for the long term. Thus far most projects have grown at decent rates. Their NPV should not be very big.
The value added by management to shareholders can be measured as:
- Value Add (VA) = NAV – MV (3)
Which simplifies when combined with (1) and (2) to:
- (NAV – MV) = – (NPV + HO – (MU – MUm) (4)
In short, this means that as HO is a negative value to shareholders, as is the overestimation of the value of unlisted assets, for MV to be greater than NAV, NPV must have a significantly large positive value sufficient to compensate for the detriment of HO and the difference between MU and MUm.
Further, Equation 4 demonstrates that decreasing the difference between MU and MUm (by say, listing the unlisted shares) would decrease the discount from NAV to MV by providing the company with an objectively determined value that may well exceed its lower implicit value when unlisted. ARC does have charge relatively hefty fees for management; however, it is virtually debt free, significantly lowering the cost of capital. Management is paid between 1.25% and 1.75% of the average of annual opening and closing NAV. Unfortunately, this does not align with the incentives we as shareholders want to see. While the increase in NAV is essential, shareholder value is only reflected in share price growth, thus management is not incentivized to improve the NPV value. Furthermore, this is quite a hefty fee to be paying on top of the 0.25% cash management fee and directors fees – which are around the industry norm.
As Kantor notes, when management can show that their investment decisions are good ones, the market will reward them by valuing upwards the theoretical NPV, expecting continued good investment returns. This explains why some companies – like PSG – have traded at premiums to their NAV in the past. As mentioned, this means that any increase in the performance of the underlying assets not only serves to increase ARC’s NAV, but also to shrink the gap between that NAV and the share price.
Further, Kantor suggests that one should pay particular attention to the potential for “mean reversion” of the usual discount.
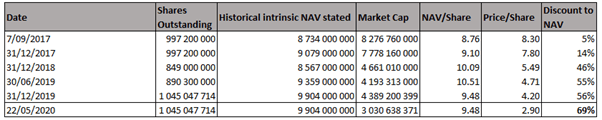
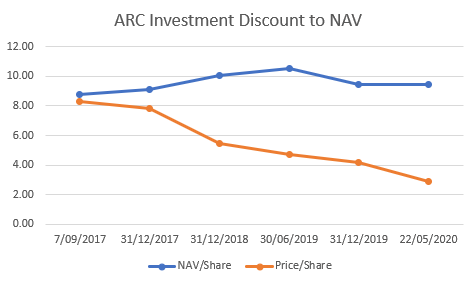
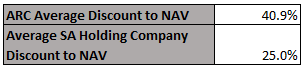
The figures below suggest that ARC is currently trading at a discount even to its average discount – which has admittedly been widening over the period since listing.
This discount is defined as
- (NAV-MV)/NAV % (5)
When combining this with Equation 4 we can simplify to:
- Discount % = (HO + NPV – (MU – MUm))/(ML + MU – NDt) (6)
Eventually we have arrived at the necessary formula. Any change that decreases the top line or increases the bottom line will reduce the discount. ARC cannot reduce debt significantly – it does not have enough debt. ARC’s head office expenses are high, but not nearly enough to justify the drastic discount % relative to its industry peers. Thus, only two possible things could be happening:
- There is a big discrepancy between MU and MUm
- ARC’s management are expected to make abysmal investment calls going forward (they have a very large negative NPV).
It is hard to justify such a large negative NPV given that ARC is – as mentioned – 95% invested already and therefore cannot be expected to have a highly active investment programme. Thus, the fundamental reason that the market is giving ARC such a big discount to NAV is simply because it believes they have way, way overstated the value of their unlisted assets.
This is important, not because there is disagreement, but because the size of the disagreement is astronomical. ARC believes that their total assets are worth nearly 3 times more than the market is valuing them at. However, the total assets already include 3 listed companies (Afrimat, Kropz PLC and Alexander Forbes) totalling 25% of ARC’s portfolio.
25% of the NAV is listed and therefore should be easily determinable.
25% x R10/share = Approximately R2.5 per share of listed value.
Alternatively, working out the listed value of ARC’s share price can be done by summing the calculations for the listed constituent’s Market Value Estimate in Part 1’s figure 6. Here you arrive at around R1.8 per share of listed value.
At the time of writing the share price is R2.9. This means that the value the market is placing on the unlisted companies is R0.4 per share. This is compared with the R7.5/share that ARC’s management say it is worth. This is a whopping 18.75 times difference. The difference between MU and MUm must therefore be an 18.75 multiple. Surely, that is a margin of safety of note.
These are all very approximate figures; however, the point is that you are paying between 62-86% of the share price for no more than 25% of the company. This is not necessarily an indicator of the value of the underlying unlisted assets, but it is a very, very decent margin of safety. Essentially, your odds are this:
Downside: R0.4/share
Upside: R7.1/share
This is a risk to reward ratio of 1:17.75, all excluding growth in the underlying assets. If there is a bet to risk being wrong on, it is this.
This discount is defined as
- (NAV-MV)/NAV %
When combining this with Equation 4 we can simplify to:
- Discount % = (HO + NPV – (MU – MUm))/(ML + MU – NDt)
Eventually we have arrived at the necessary formula. Any change that decreases the top line or increases the bottom line will reduce the discount. ARC cannot reduce debt significantly – it does not have enough debt. ARC’s head office expenses are high, but not nearly enough to justify the drastic discount % relative to its industry peers. Thus, only two possible things could be happening:
- There is a big discrepancy between MU and MUm
- ARC’s management are expected to make abysmal investment calls going forward (they have a very large negative NPV).
It is hard to justify such a large negative NPV given that ARC is – as mentioned – 95% invested already and therefore cannot be expected to have a highly active investment programme. Thus, the fundamental reason that the market is giving ARC such a big discount to NAV is simply because it believes they have way, way overstated the value of their unlisted assets.
This is important, not because there is disagreement, but because the size of the disagreement is astronomical. ARC believes that their total assets are worth nearly 3 times more than the market is valuing them at. However, the total assets already include 3 listed companies (Afrimat, Kropz PLC and Alexander Forbes) totalling 25% of ARC’s portfolio.
25% of the NAV is listed and therefore should be easily determinable.
25% x R10/share = Approximately R2.5 per share of listed value.
Alternatively, working out the listed value of ARC’s share price can be done by summing the calculations for the listed constituent’s Market Value Estimate in Part 1’s figure 6. Here you arrive at around R1.8 per share of listed value.
At the time of writing the share price is R2.9. This means that the value the market is placing on the unlisted companies is R0.4 per share. This is compared with the R7.5/share that ARC’s management say it is worth. This is a whopping 18.75 times difference. The difference between MU and MUm must therefore be an 18.75 multiple. Surely, that is a margin of safety of note.
These are all very approximate figures; however, the point is that you are paying between 62-86% of the share price for no more than 25% of the company. This is not necessarily an indicator of the value of the underlying unlisted assets, but it is a very, very decent margin of safety. Essentially, your odds are this:
Downside: R0.4
Upside: R7.1
This is a risk to reward ratio of 1:17, all excluding growth in the underlying assets. If there is a bet to risk being wrong on, it is this.
