
Introduction
All good research begins with narrative. Listing in 2002, Santova began as a clearing and forwarding firm, and have progressed through the phases to a third-party logistics provider (3PL) and finally to where they are today: a business process outsourcing integrator specialising in supply chain management services.
In the last half-decade, the company has continued to grow steadily, has reduced debt, and has expanded into more countries, onboarded more clients and now offers more services than it did in 2016. Yet, the market has devalued it from a market cap of R650 million to R270 million.
There is no way of knowing exactly why the market has serially downgraded Santova, but the below outlines several possible reasons.
- The company is priced in line with its local logistics & transport peers, rather than more similar international 4PL firms. This suggests the market is viewing Santova as a locally oriented logistics company and is applying the usual SA/emerging market discount.
- The slowing rate of globalisation and an international trend towards isolationism and protectionist policies, possibly expedited by COVID-19, could present Santova with some challenging headwinds.
- South African regulations indirectly require a hefty investment in working capital as custom duties and VAT must be funded on behalf of the clients. This places default risk on the company’s debtors’ book, again exacerbated by COVID-19. This also subjects the company’s cash flow to a high degree of variability as a minor timing difference in the working capital can result in a large cash flow variance.
- Their offering is largely tech-enabled. As a small company still establishing itself on the global stage, this subjects them to disruption from more innovative technology, particularly from larger players who have more to spend on better technology and who can leverage their existing client relationships in implementing this tech.
- There is no catalyst for value realisation in sight, and many investors may be duly wary of continual underperformance from a high-beta stock that presents liquidity risk, currency risk, delisting/takeover risk, is too small for institutional investors and shows no signs of upward momentum.
- The company’s aggressive acquisition policy may bring with its cultural challenges and increased amounts of goodwill on the books (as overseas firms typically command higher price multiples than local ones, they may overpay for the expansion they need).
These are all valid concerns and will be addressed thoroughly in the bear case below.
That said, the company still presents an attractive investment opportunity at the current valuation, with the investment thesis being as follows:
Santova is severely undervalued. As mentioned in the Explain Like I’m Five segment above, this is a growing going concern trading at a P/E ratio of 2.2 when you remove the cash total from the market cap. The valuation will be unpacked and covered from various angles in the titular segment. Such low valuation provides significant upside asymmetry.
This company is both resilient and offers convex optionality. It is a slow-growth, long-duration company run by adaptable management who have skin-in-the-game and who have shown capacity to innovate. The business model is scalable and capital- and asset-light. The core offering gives the business a data-enabled flywheel, network effects and a sticky product with high switching costs once implemented. Finally, relative to its peers, it has industry-leading margins, competitive (and understated) returns and – due to its small size – can capitalise on niches that would otherwise be missed by larger players.
All considered, it is the argument of this article that the market is (and has been) mispricing Santova for several years now and that the economics, management and valuation of the business all make it a strong investment opportunity.
Business Model
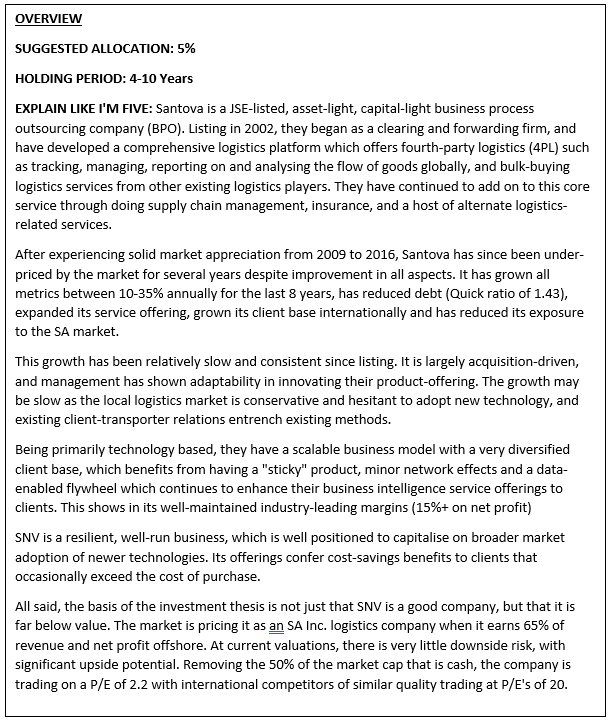
To put it simply, Santova have two primary offerings:
- A “one-stop-shop” platform which offers fourth-party logistics (4PL) services on everything from clearing, forwarding, tracking, managing, reporting, and bulk-buying of logistics services.
- Data analytics and business intelligence services based on data derived from client and supplier use of the above platform.
The Business Model Canvas in Figure 1 below outlines the holistic business model of the company.
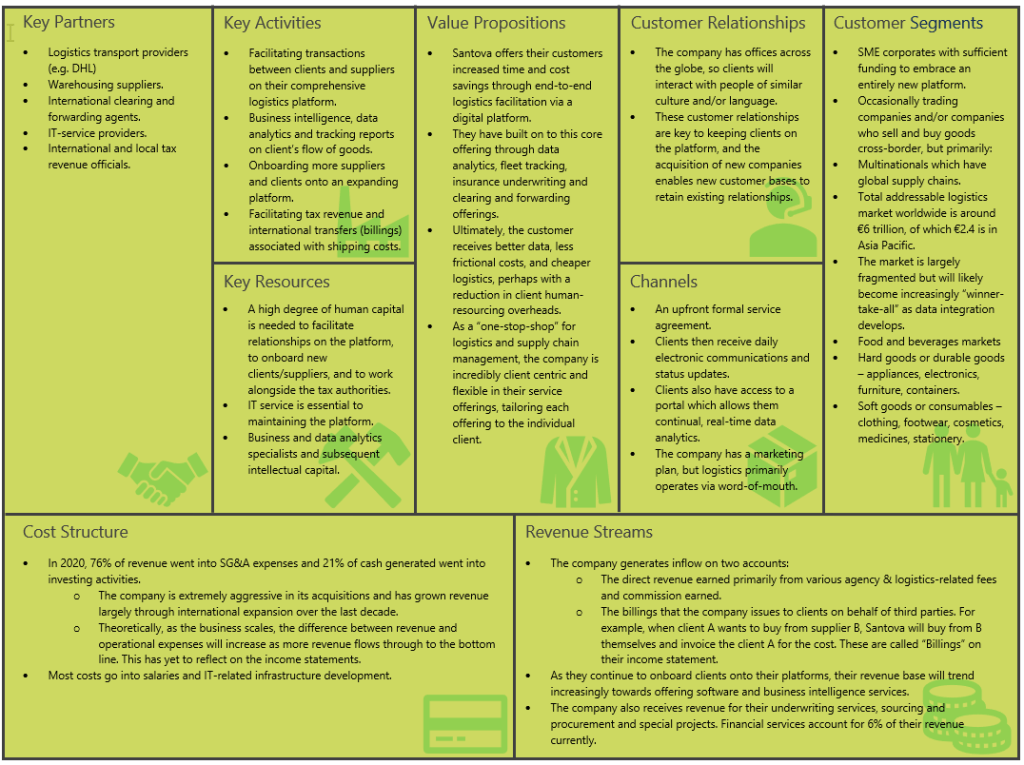
As mentioned in the opening paragraph, Santova has progressed through multiple iterations of itself to arrive where it is today. This is exemplified well in Figure 2 below. What began in Level 1 is now midway between Levels 3 and 4. Management is focussing heavily on the business engineering model and is continually embracing technological innovation and an expansion on the Internet of Things (IoT).
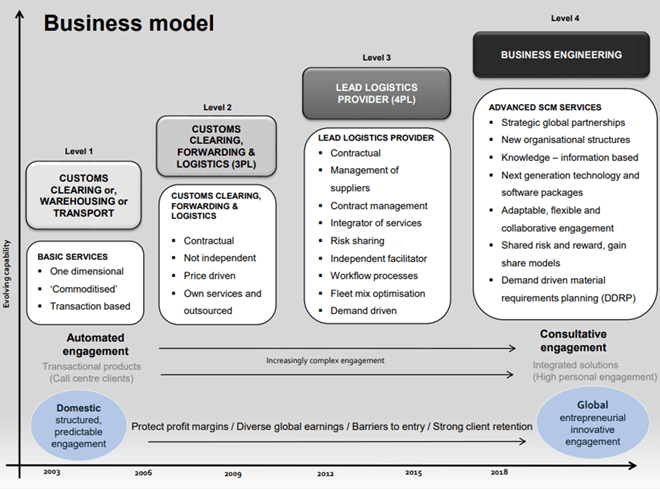
In a nutshell, SNV is fundamentally a network of relationships stacked onto a complex technological platform. They own no legacy assets like warehouses or fleets, and as such require little very little maintenance capital expenditure (8% of operating cash flow in 2020). Further, their on-book asset base is 65% current assets, most of which is Cash and Account Receivables (Figure 3).
That the company leverages off other providers’ fixed assets like ships and warehouses means they do not incur much capital expenditure or financing costs, nor do they need to worry about a lack of use or filling capacity during slower periods. This subjects them to less risk during periods of volatile demand as they can scale up or down to meet the market’s requirements. Their tech-enablement and lack of reliance on legacy assets also enables Santova to offer more bespoke solutions to their clients, and add-on or remove products and services according to the client’s needs.
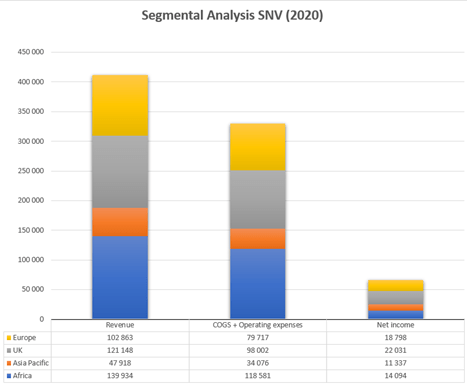
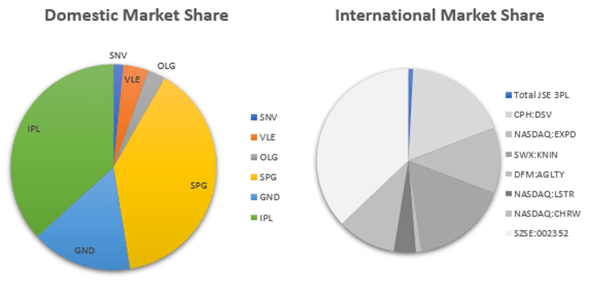
The company is also strongly diversified with almost 5000 different clients across varying markets and the top ten accounting for no more than 12% of its revenue. Further, as of February 2020, only 34% of its revenue and 21% of its net profit came from within Africa (Figure 4). This diversity, combined with the transparency and analytical capability of the platform of the platform affords the company a strong degree of resilience and creates a buffer against many shock factors.[1] It also provides SA-based investors with a hedge against the depreciation of the ZAR.
This diversity also enables Santova to progressively increase their sales and/or capability to manage bigger swathes of a client’s supply chain by utilizing their knowledge base in several areas of logistics and achieving synergies from broad service offerings. Regular 3PL providers cannot do this as they are neither as diversified nor as adaptable given their asset-base.
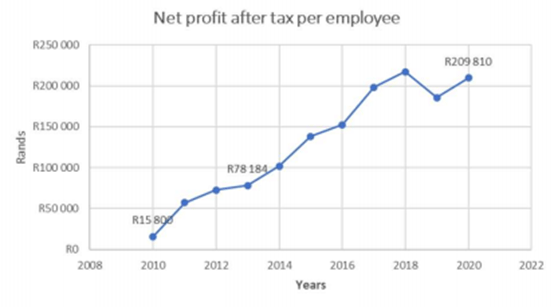
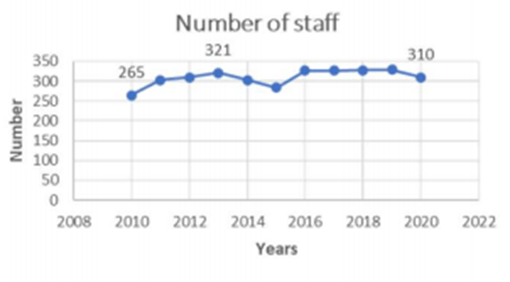
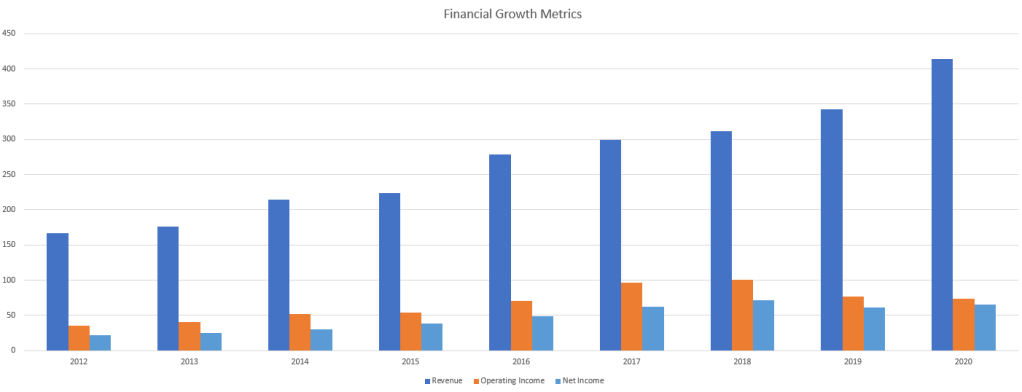
Figures 5, 6 and 7 (presented in SNV’s most recent investor presentation) tell an interesting story of how they have been able to keep employee headcount mostly constant over a decade, while improving both turnover and operating profit. This is due largely to the automated workflows and software-based nature of their product/service offering.

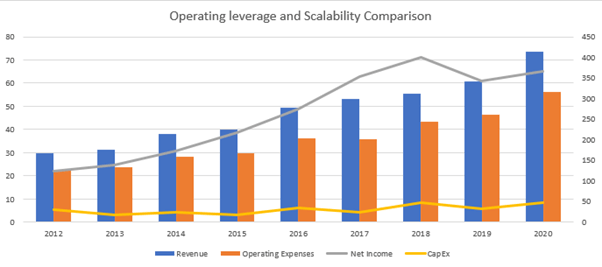
As the company scales, they obtain greater buying power to negotiate with transporters for lower bulk rates. These cost savings can be transferred directly to the clients, enhancing product value and lowering client costs. Further, as the business is largely tech-enabled, an increase in clients should not require a similar increase in capital expenditure. This has been reflected in the business financials (Figure 8).
An increase in clients also reinforces the network effects that afford the product both high switching costs and more attractive. Increased clients mean increased data on more trade routes and better business analytics, it also provides the option of Santova buying for client A from client B as the network scales. The steady gain in market share that the company has worked for is enhanced by this data flywheel. That said, this is more speculative than certain, and the future is notoriously impossible to predict. The tech-focus and innovation however offer investors the chance to gain optionality and capture potential upside without requiring extreme predictability.[2]
In a recent report, Mckinsey identified several important factors that contribute to a resilient transport and logistics company.[3] These are unpacked in Figures 9 and 10 below, but can be summarized in three primary principles:
- Implement an Agile ways of work.
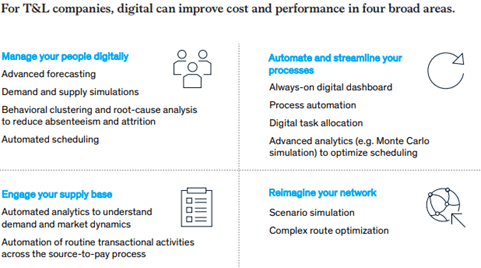
- Automate and digitize processes. Use this to enhance business intelligence and data analytics.[4]
- Deleverage balance sheets.
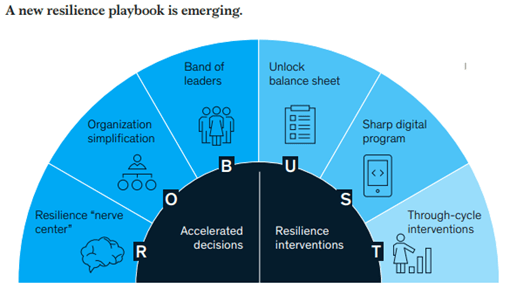
In the wake of COVID-19, where many companies are only now waking up to the benefits of resilience, Santova has been basing its tech-heavy business on these principles in various forms for the last decade. Like all businesses they are exposed to black swans. If one could predict these events, exposure could be mitigated, but they are by nature unpredictable. There is no way to guarantee they have sufficient redundancies and “slack” in their operations, but their transparent and measured operations, diversification and extensive tech-based experience (which is usually implemented through an Agile methodology) suggest they are likely more resilient than competitors.
Further, as transport/warehousing are largely commoditized, and business intelligence consulting is largely not, the more Santova progresses towards offering a digital platform with data enhanced consultancy, the more likely they are to experience beneficial pricing power on both their buying and selling fronts.
However, no business model is perfect and in Santova’s case several business-specific challenges include their highly acquisitive strategy and the negative feedback loops that impede them from gaining market share. The risks posed by acquisitive growth will be discussed later. While there are several positives about feedback loops that prevent rapid gains market share (i.e. developing grit within the company, acting as a barrier to entry for newcomers and, per Slingerland and Johns, lengthening the growth curve)[5], they are called negative feedback loops for a reason.
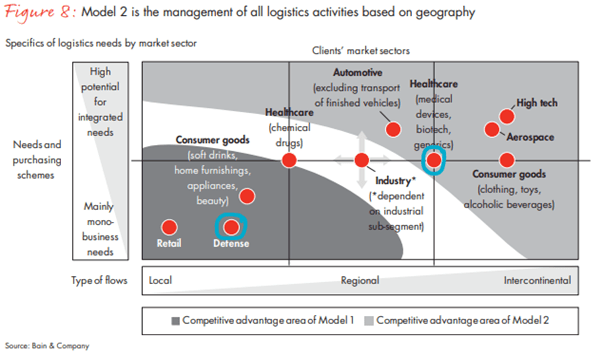
There are two optimal models for comprehensive management of supply chains: an activity-divided model (Model 1), and a geographically divided model (Model 2). The blue circled dots in Figure 11 highlight two of Santova’s client industries. Their difference in industrial client base prohibits Santova from maximising the competitive advantage of its organisational structure. This is one of the few instances where Santova’s diversification acts against them.
There is a very strong human element in logistics, with good relationships underpinning most of the transactional likelihood, and the industry is incredibly commoditized and in South Africa, many firms are slow to adopt new ways of work. Further, while an employee does not need managerial oversight to, for instance, sign up a new transporter, they will need oversight to adopt a company-wide transport system. This subjects Santova to extra scrutiny in an already commoditized market.
To counter this commoditization, per Australian MD Leon Notelovitz, they focus on dominating niche, compliance-intensive spheres of the market like transporting pharmaceuticals and defence goods cross-border. These areas are typically sophisticated, technical and contain a greater level of service and client-centricity, all of which increase their offering’s stickiness and margins.
A final comment on the company’s business model: the trajectory seems increasingly technology oriented. In the Chairman’s review of their most recent annual report:
“As we continue to advance our technological development, functions, processes and systems will be further integrated and engineered for effectiveness as well as greater efficiency. This, together with the introduction of new services or products such as SUREcargo, which are fully automated (no human intervention required), will largely eliminate the typical corresponding increase in costs as turnover grows. Operating margins should be significantly improved as we move up the developmental curve towards blockchain technology.”
Industry Analysis
The total logistics market is an incredibly complex place. It consists of all sorts of supply chains weaving across the globe wherein firms (as broadly categorized in Figure 2) interact dynamically. Such complexity makes it challenging to provide accurate figures on the broader market, and it is precisely this broader market which Santova aims at addressing. Their products (as discussed above) are largely goods- and industry-agnostic so their total addressable market is essentially the entire logistics sector (Figure 12).
Of this broad market, Santova prefers to capitalise on the smaller niches left behind or overlooked by the bigger players (due to the small relative size of the market). It is important to note that Santova is a very small player in a very large pond and is at a disadvantage to larger players who benefit from economies of scale, larger cash positions and existing, well-entrenched relationships. This disadvantage is surprisingly not reflected in the margins of the competitors (as discussed under competitive analysis).
This is a fragmented industry globally, but in recent years has become less so as many companies are looking to acquire smaller competitors. As data enhanced analytics and technology advancements progress the industry, the high likelihood is that it will become increasingly profitable and increasingly concentrated in a small number of “winners”. As transport and warehousing have minimal product differentiation, the primary selection criteria for choosing a 3PL service provider is price, which again makes life very difficult for the smaller or asset-based players. All this suggests that the industry has the potential for high rewards but is subject to fierce competition with significant scale advantages.
In a 2017 publication on the Sharing Economy, DHL outlined some of the significant transitions that have been happening in the T&L space since about 2008. These are akin to the transition from regular taxis to the dominance of Uber, or hotels to Airbnb: technology is enabling people with the scalable and cost-effective use of assets through a platform rather than needing to buy the underlying assets themselves. In a nutshell, this is Santova’s business model.
Further, in this BCG report, the authors highlighted several things that logistics companies should focus on: lean organisation, digitisation, big data analytics, process automation[7] and offering innovative, bespoke solutions were atop the list. The same authors identify six megatrends for the industry: the rapid development of emerging markets, urbanisation, sustainability, infrastructure congestion and scarcity, e-commerce, and digitization. Santova has already established a base in most emerging markets in Africa and Asia, and already has a big focus on digitization.
The advent of digitisation and automation of the T&L industry has long been known about.[8] However, many firms still struggle with the adoption of newer technology. As such, there have been many start-ups, most focusing on niches prior to scaling. Santova has the benefit of being already established, yet with a start-up-esque emphasis on next generation technologies. This PWC article suggests that there are 4 primary outcomes for the T&L market over the next decade:
- Incumbents increase efficiencies rapidly, collaborate more, develop new sharing-based business models and implement greater internet of things.
- New entrants become significant players and take market share from the incumbents through new business models based on data analytics, blockchain or other new tech.
- Incumbents acquire start-ups to cover major markets and leverage their understanding of customer behaviour to optimise supply chains.
- Major players merge to extend their geographical scale and enhance their cross-modal coverage.
In most of these scenarios, Santova is likely to fair reasonably well. There is the threat of acquisition, and of incumbents out-offering Santova’s model, but their history of innovation and existing client relationships render this exact scenario less likely.
A biased source, but one of the better summaries found of the broader logistics industry trends is this slide from Santova’s recent investor presentation (Figure 13). For an unpacking of these trends in detail, see this slide deck from the World Economic Forum and Accenture.

Effect of COVID-19
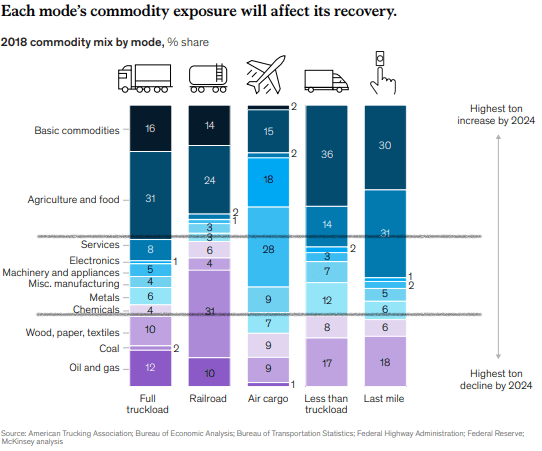
COVID-19 has undoubtedly shocked the T&L sector in the early half of 2020 (Figure 15). This McKinsey article framed the post-COVID-19 recovery as depending significantly on the T&L provider’s mix of customers and products. From its breakdowns, Santova’s industries appear well positioned for averagely fast recovery (See Figure 14 below; Santova operates majority within the banded grey lines).
As far as Santova is concerned: per CEO, Glen Gerber, the advent of COVID-19 on the industry has been marked (cf. Figure 15), but non-asset-based players have been far less effected. Further, Santova does not operate in the alcohol or tobacco industry, so little of the product-specific bans have damaged their business. Broadly, South-East Asia and the Pacific trade is almost back to pre-COVID levels and this is where Santova derive a large amount of their revenue.
In another McKinsey article, the authors highlight the attributes that will set a company up for success post- and during-COVID-19. These include those that develop granular scenarios on how demand will evolve, appropriate playbooks to use in each case and live mechanisms that track which scenario is unfolding. Santova, who operate often in a bespoke manner, have been creating these scenario-analyses for international clients for the last several years.
Competitive Analysis
Moving on to the competitive analysis, Santova stacks up well against local competitors in performance, outperforms both local and international competitors in margins, and – relative to international peers – is significantly undervalued. Its returns on invested capital and equity are mediocre at best; there is a possibility that this is due to their acquisitional growth and the goodwill that lays heavily on the books. In Figure 16 below, the blue SNV is compared to a broad range of domestic (dark grey) and international (light grey) competitors.
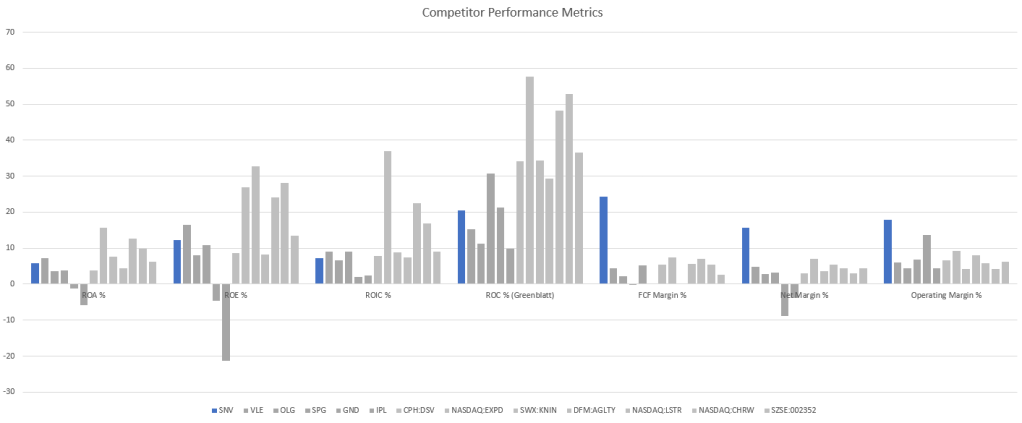
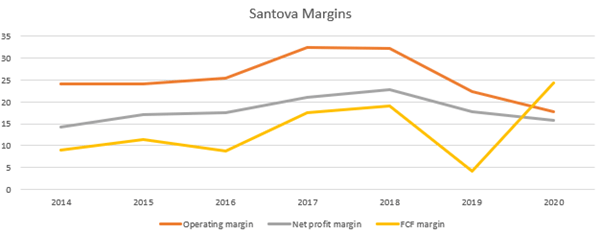
The immediate takeaway is the significant difference in margins between SNV and the others. These margins have been mostly maintained over the last 6 years but have been declining somewhat in the last two. Furthermore, the significant FCF margin in 2020 is not the norm as that margin has typically trailed both operating and net profit margins (Figure 17).
Several factors may explain the sustained margins, some of these are as follows:
- Santova’s longstanding automation and software development focus.
- Their competitors are more asset-based. These are lower-margin models with more operating leverage.
- Labour differentials between South Africa and international companies allow Santova lower wage costs.
- The niche “compliance” areas of logistics that Santova focusses on mentioned above offers higher margins.
- Being a smaller player, their customers are usually not going to be the massive corporates. Rather, they will focus on SME’s in their niches and as such are not subject to the pricing power of the larger players.
The secondary takeaway from Figure 17 is the low-to-average relative performance of SNV in the returns department. It is much lower than international peers, and VLE has it beat in the local front. Here it is possible that SNV’s acquisitive growth distorts the picture as its operating ROIC (less goodwill) has averaged a more respectable 16% over the same timeframe.
It is important to note that none of the local South African companies operate with similar business models to Santova. The closest one to them is Value Group, but even they have significant investment into hard assets. They are only so good of a comparison. Most international peers too have expanded into hard assets like trucks and warehouses, so one can be duly curious about whether Santova will ultimately do the same at some point in the future.
Presently, Santova is a tiny player in the overall market with the dominant players dwarfing it (Figure 18 is a rough approximation using market cap). As non-asset-based supply chain managers scale, they improve their bulk buying power. As SNV is the smallest of its peer group, they have the longest runway to benefit from growth and returns to scale across its network. Although it already has substantial margins, its margins would theoretically increase as it scales customers, market segments and geographies. It will be interesting to watch how Santova attempts to scale when it can no longer operate solely in niches unoccupied by larger T&L companies.
Their small size also subjects them to takeovers, delisting threat and makes it challenging for them to compete in certain markets with the more established players who benefit from synergies and economies of scale. Increasing employee turnover becomes a greater threat, as – partially because of their niche focuses – the education of their employees in international trade, technical compliance and industrial knowledge is expensive and time consuming. They also cannot compete with the salaries offered by larger firms.
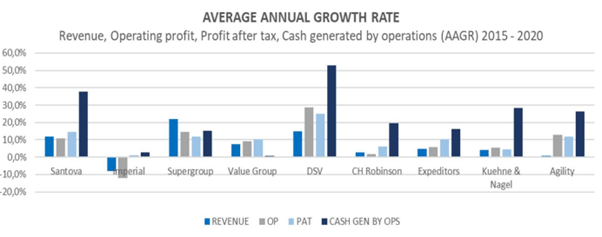
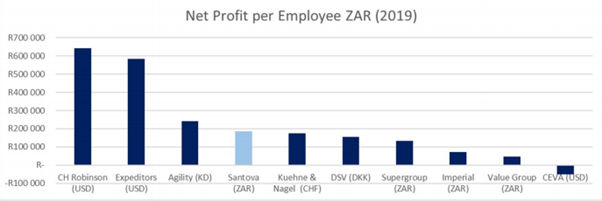
Relative to peers, Santova has shown competitive growth (Figure 19) and is competitive with some of the top international players on a Net profit per employee basis (Figure 20). Note however, that in the 2020, SNV’s cash generated by operations grew by 440% and has been highly erratic, coming off a 5 year low in 2019. Thus, the data presented in Figure 19 is slightly distorted.
The bottom line is that Santova has – over the past decade – proved their business model to be at least competitive (likely, better than) with the larger players. They a very small fish in a very large pond, but their model is scalable and robust to shock factors. They have grown decently to-date and appear well positioned to capitalise on the technological advances of the coming years. It is tough to say they have an incredibly resilient moat against competitors given their average ROIC and lack of existing scale, but their substantial margins offer a strong counter to this.
Bull Thesis
The bull thesis is that Santova is resilient company, selling well below intrinsic value, with adept and aligned management and a strong competitive positioning which offers South African investors well-priced hedge against the ZAR, as well as a degree of optionality. The resilience, optionality and competitive positioning of the company has been expanded upon above. This section will outline the intrinsic value, and a brief discussion on management and their skin-in-the-game.
An estimation of intrinsic value is never a precise number. It is an attempt to reduce a range of future outcomes, all influenced by an inordinate number of factors, to an approximate value today. It is also subject to black swans, fat tails and human biases, all of which make it much more art than science. Several factors that aid in approximation are
- if the company has shown consistency in the past, and
- if the value is a range rather than a precise number.
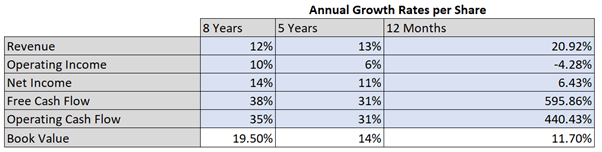
Fortunately, Figures 21 and 22 attests to the consistency of Santova’s growth in several key metrics. These growth rates are unpacked in Figure 23.

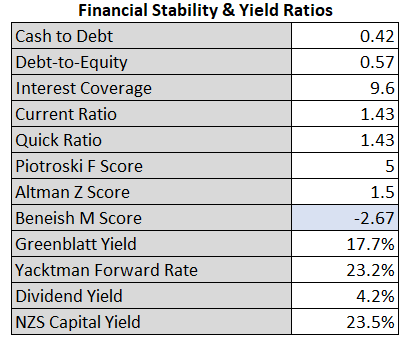
They have steadily increased both dividends per share and the dividend pay-out ratio since 2013. The company is in a comfortable financial position and ticks the box on several typical metrics (Figure 24). By way of a brief unpacking, the yields mentioned below are various ways of evaluating prospective returns without looking to traditional DCF-based predictions. The ratios mentioned are primarily around financial health and (as evidenced) Santova is not unduly indebted and has comfortable interest coverage. The scores (F, M and Z) are all used – typically in conjunction – to determine a company’s financial health and are discussed here. Suffice it to say that Santova is not in a worrying position.
Valuation
In valuing Santova, a very broad variety of methods have been used.[10] The basis of the valuation are four scenarios: worst-case, base-case, best-case, and total-loss. These are attributed a 20%, 30%, 20% and 30% chance of occurrence, respectively. Further, the assumptions used in the cases are very conservative, with the best-case growth rates equal to or less than the 8-year CAGR exhibited by the metric to date (Figure 23). Base-case growth is assumed roughly half of this and worst case is no growth.
Using these, several simplistic DCFs (at a 20% discount rate) and a couple of other well-known valuation measures, one arrives at the relative valuation fields in Figure 25 below. The probability weighted aggregate for these valuations is R2.9/share, but this is a rather meaningless figure in its specificity.
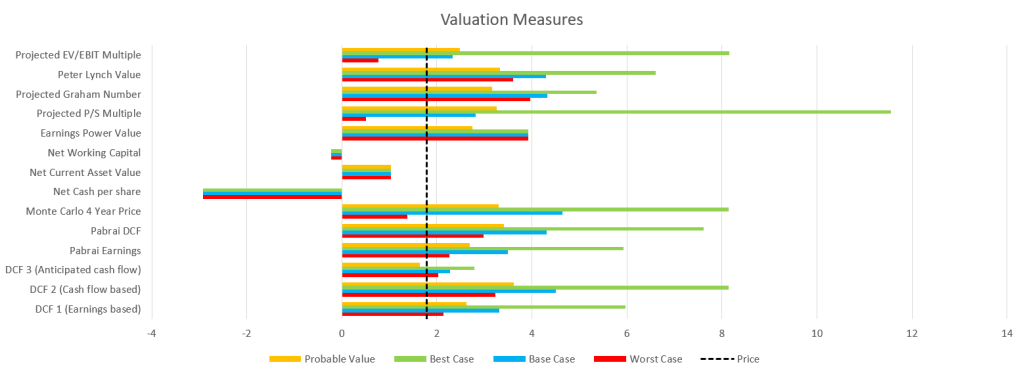
The contribution of this type of valuation practice is to see where – relative to a set of example values – the market is pricing Santova. Given the conservativism in the valuation, the consistency of historical growth and the broad range of valuation measurements, it appears that the market is pricing Santova currently well within its worst-case scenario. This suggests that there is decent upside and that the current price has a substantial margin of safety. Even during the recent COVID-inspired selloff, the share price only fell as low as R1.2 per share. This may be considered an approximate floor.
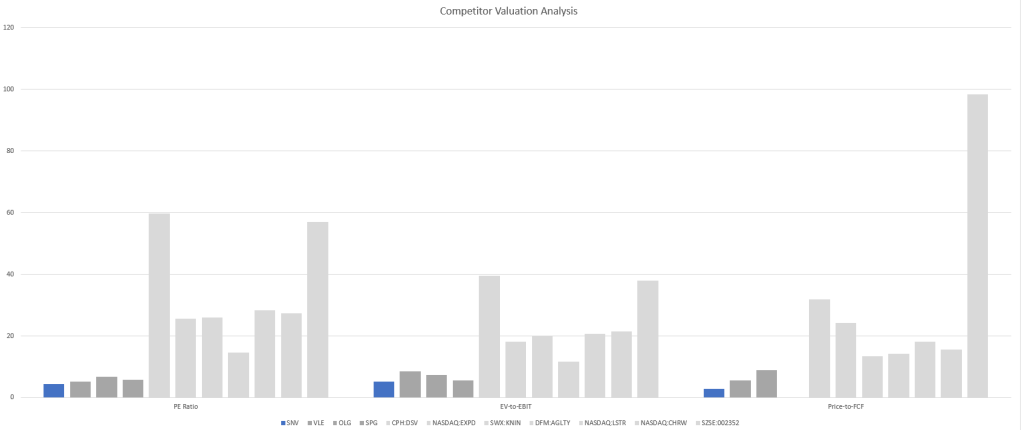
In a comparative valuation, Figure 26 shows the substantial difference in price between JSE listed companies (dark grey) and their international peers (light grey). Note how SNV (blue) is significantly cheaper than both peer groups.
Excluded in the above valuations (comparative and intrinsic) is the fact that 46% of the share price is cash. As mentioned earlier, factoring for this cash balance changes the relative valuation to a P/E of 2.2 and places the price in Figure 25 deep within the worst-case valuation.
Speculation around a catalyst to unlock value is only so valuable. At present, there is no prospective upcoming merger, results reporting, secondary listing or in-depth coverage that may serve to unlock value and as such, investors will have to resign themselves to a long-term hold.
Management
Management is always a challenging aspect to evaluate. Currently, they own around 17% of the business and have been repurchasing shares since 5th of March 2020. Both facts are about as empirical as management evaluation is going to get. There is evidenced skin-in-the-game, but admittedly, 17% of a R250m company is only R30m invested. That is not exactly a boatload per manager, especially considering that there are quite a few people comprising shareholders of that 17%. Nevertheless, for a small company like SNV, this is sufficient to say that management are aligned with shareholder interest.
To summarize the approach management takes in their most recent annual report, a quote from CEO Glen Gerber:
“In this regard, we will continue to focus on building value per share by focusing on strong operating margins, cash flow and profitability. Balancing buying own shares back when the share price is low versus making strategic acquisitions.”
This is an encouraging statement showing prudent capital allocation from the business leader. Glen has been with the company since 2003, and although not a founder-CEO (as most CEO’s of our favourite companies), he has nevertheless been with the business through its entire developmental transition depicted in Figure 2 above.
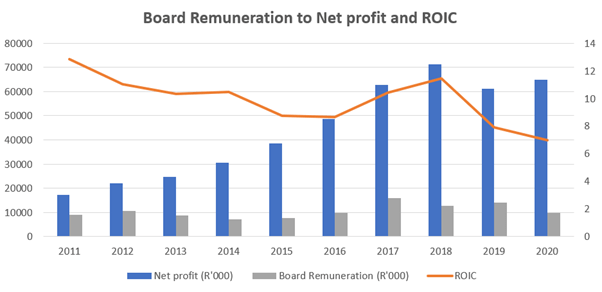
Figure 27 below compares director remuneration relative to ROIC and net profit. As can be seen, firstly the board’s payment is not unreasonably high; secondly, they appear to correlate loosely with the appropriate metrics. It would be encouraging to see a clearer correlation with ROIC, but this is not unexpected given the increased funds that a rise in net profit brings.
Bear Thesis
Hopefully, this article has presented a somewhat objective view. There have been several issues mentioned thus far around Santova, but this section will serve to unpack a couple of the major concerns. Here, the bear theses are broadly categorized into those bearish of the T&L industry at large, and those bearish of Santova specifically.
Those industry related concerns are largely uncertainty based rather than structural. These include concerns around the effect of COVID-19 on supply lines; the effect of US-China tensions and an international decline in trade due to increasing protectionism; the structural impediments to trade that South Africa implements; and the highly commoditized nature of the industry.
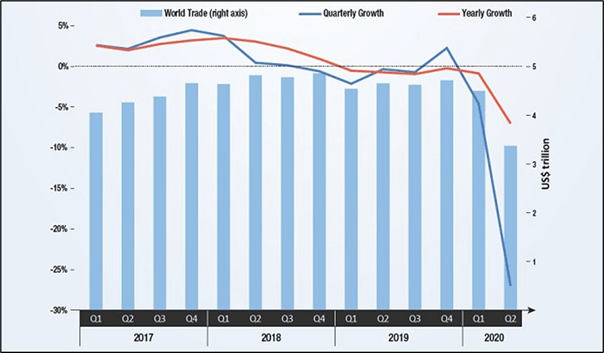
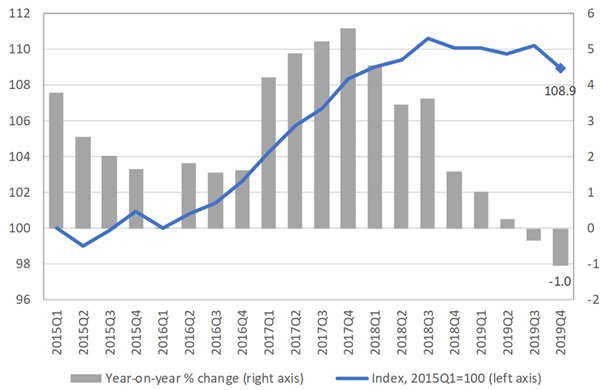
From a historical perspective, there have been two waves of globalization. The first wave started in the 19th century and came to an end with the beginning of the First World War. The second wave started after the Second World War and is still continuing.[11] This second wave has been slowly declining in recent years (Figure 28) and is likely to be exacerbated by COVID-19 (Figure 29).
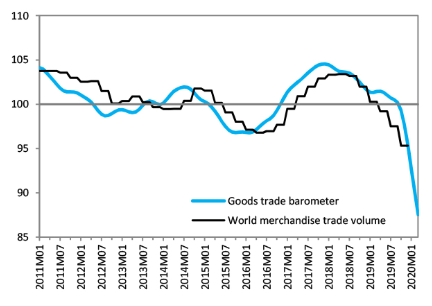
The advent of COVID-19 has brought a fresh awareness to countries and multinationals of the importance of slack and resilience in their supply chains. As a broad stroke, this suggests the globalisation of supply chains may decrease in favour of localisation. This creates uncertainty around the future of international supply chain management. The counter to this is that these chains are incredibly complex, and many have come to depend on the depressed labour rates in the developing world.
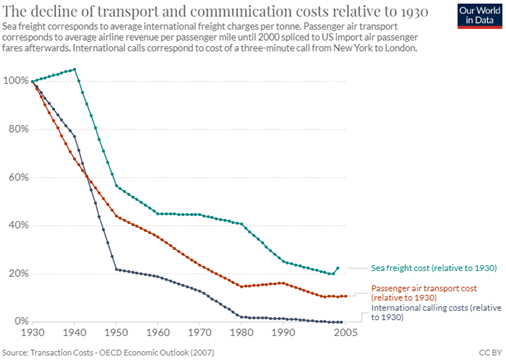
Finally, the cost of transport and communication costs has decreased dramatically over the last century. While it has been flattening out since the 1980’s, this indicates how commoditized the transport industry is (Figure 30).
The commoditized nature and the uncertainty presented above are not entirely bad things. Uncertainty creates dislodged prices relative to underlying risk, and the commoditization is more on the supplier-side of Santova’s business. A case could be made in both instances that Santova (and its investors who buy in at uncertainty-depressed prices) actually net benefit from these two theses.
On those theses relating specifically to Santova, there are a couple:
- Their cash flow and earnings quality are inconsistent at best.
As far as earnings quality and cash generation go, Santova’s cash flow has been erratic historically, and 2020’s significant FCF is a definite outlier. Figure 31 below shows the earnings quality over time.
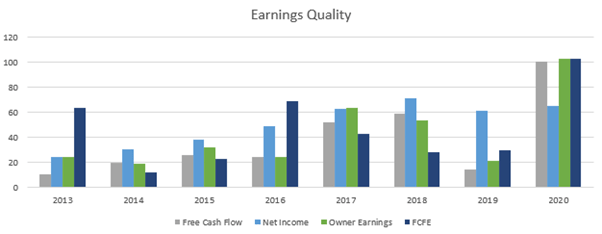
The trend of all metrics is an upward one, but their variance is salient. There is little regularity between earnings and other metrics, and the reasonable stability of earnings suggests potential management thereof. It is not uncommon in the JSE to manage and stabilise earnings (in Santova’s case, perhaps through bonus provisions or credit impairments). It is odd that the H1 and H2 of 2019 SA segment had the exact same net profit.
- South African operations require a that substantial amount of investment in working capital as custom duties and VAT must be funded on behalf of the clients.
This places default risk on the company’s debtors’ book, again exacerbated by COVID-19. This also subjects the company’s cash flow to a high degree of variability as a minor timing difference in the working capital can result in a large cash flow variance. Several ripostes to this are that:
- They do not fund the entire debtors’ book, but rather use a discount facility provided by Nedbank.
- They earn finance income on the amount funded.
- Most of the book is insured (around 85%)
- The SA-based operations are decreasing in relevance as the business globalises.
However, despite the above, this debtors’ book is still a weight on performance and subjects the company to downside risk. Further, in SA’s junk-rated market, the credit underwriters start to reduce the ability of debtors to raise capital. This significantly detriments the importers. This is discussed more in depth below.
- A larger player with more money, a larger client base and better technology may be able to displace them.
This is the key business risk and, other than innovation and dominance in their niches, it is one that this author struggles to find a defence against in Santova’s business model.
- There is no catalyst for value realisation in sight, and many investors may be duly wary of continual under-performance from a high-beta stock that presents liquidity risk, currency risk, delisting/takeover risk, is too small for institutional investors and shows no signs of upward momentum.
Many of these factors are structural and unlikely to change any time soon. With no catalyst, there is little incentive for institutional ownership. Barca Capital – a long-term investment management firm based in San Francisco – does own >10% of the company, but given the factors above, it is unlikely that any further institutional investors will be willing to deploy large amounts of capital into this small business.
- The company’s aggressive acquisition policy.
Typically, organic growth is far preferred to acquisitions. However, in the instance of offshore expansion for South African companies, this is only sometimes the case given the local headwinds to business. Offshore acquisitions may bring cultural challenges and increased amounts of goodwill on the books (as overseas firms typically command higher price multiples than local ones, Santova may overpay for the expansion they need).
Goodwill has increased steadily since 2012 at a CAGR of 22% per annum. This is more than the respective increases in most other metrics (Figure 23) above. The combination of heavy goodwill and working capital have weighed on the business’s performance to date. ROIC has rarely been significantly more than the WACC and has steadily declined over the last decade.
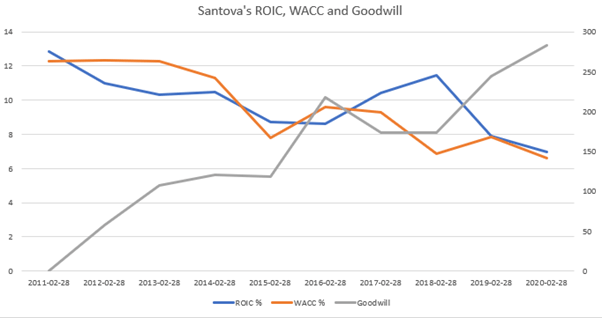
During this decline, goodwill has increased significantly, and the company has had to maintain its heavy investment into working capital. In a “Catch-22” scenario, Santova needs to expand offshore to lessen the impact of the working capital on the ROIC, but such expansion requires increasing goodwill.
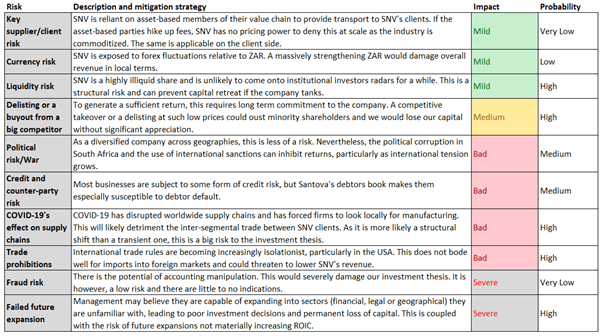
Risk Analysis
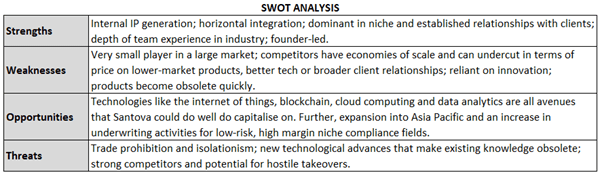
In addition to the bear theses above, there are several other risks associated with Santova. These are unpacked and/or rephrased in Figure 34 while Figure 33 below is a SWOT analysis of the company.
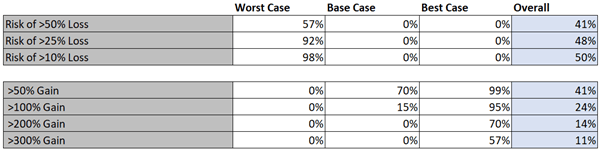
Running the scenarios set out under valuation above through a Monte Carlo simulation yields the probabilistic outcome distribution in the Figure 35 below. Such risk analysis is of limited use however given the non-normal distribution of complex outcomes.
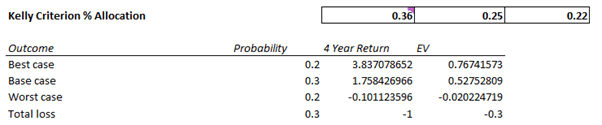
Similarly, a Kelly Criterion evaluation of the potential outcomes (explained here), is also of limited use. Nevertheless, the betsizing tool suggests a bank roll allocation of 22-36% depending on the calculation used. The value of the tool here is not so much in determining portfolio allocation, but in highlighting the mispriced nature of the bet at current valuations (Figure 36).
All in all, the low risk of blow up – given the resilience of the business through the scalable cost structure and their diversity across markets, revenue streams and industries – and the low valuation significantly limit the downside of this business. There are genuine risks, but the bet is mispriced enough to warrant making the investment.
Conclusion
To conclude: Santova is a company facing significant risks, whose macroeconomic uncertainty has brought the price to such a low level that there is significant upside and very little downside. The company has shown good growth, adept and aligned management and its business model characterises both resilience and optionality.
They are well positioned to capitalise on trends in the T&L market and have shown agility and aptitude in doing so in the past. There is a large total addressable market and the company has favourable feedback loops that sustain and deepen the stickiness of its product.
There are many bearish aspects to this investment, but most of them are external to Santova and those that are not are likely to be of decreasing importance (such as their heavy debtors’ book and low ROIC) as they continue to diversify away from South Africa.
All in all, this is a resilient company, trading at a great price, with aligned management and strong optionality and a scalable and robust business model. It is the recommendation of this article to allocate 5% of a concentrated portfolio to this Santova.
Key Metrics to Watch and Questions to ask.
On the business model:
- How much of revenue/PAT increase is due to currency depreciation?
- Very broad range of products. Are they specialised enough?
- At what point does the ability to scale earnings per employee halt? When will they have to hire?
- Are they/will they be a low-cost supplier relative to the bigger players?
- Why has operating income not grown despite increase in revenue and net profit in the last two years?
- Do a constraints analysis. Inventory, throughput, and sales.
On the industry:
- Shipping is a notoriously cyclical industry. At what point in the industry are we?
- This article suggests that shipping is a cyclical industry and will have likely supply shock catalysts in 2020 given various regulations, which combined with the capital cycle and increased demand from Chinese/Indian imports suggests a higher demand. These should catalyse a return in improved earnings for shippers.
On the company:
- What caused the FCF outlier in 2020? Assumedly the timing differences in the working capital.
- What is the potential catalyst for value realisation?
Metrics:
- Customer growth and customer retention. Are they offering a valuable service and executing effectively to maintain current customers and attract new ones? Building long-term relationships (stickiness)?
- Billing margin increase. Are they offering a service which customers are willing to pay more for? Are they benefitting from economies of scale? Increase in offshore earnings will increase billings margin because VAT and duties are settled directly by clients.
- Employee turnover and employee productivity. Human capital is the primary source of a moat and barrier to entry in this industry. Success will look like increased profit per employee.
- Average ROIC. As discussed above, this has historically been subpar. If Santova shows no signs of picking this up, then growth is likely to be value destroying rather than value creating. This is a key metric to watch.
Notes and Further readings
- Note: A lot of the research into the logistics and transportation industry below was done to better understand Santova. Thus, it is subject to a high degree of confirmation bias and narrative fallacies. It is also very challenging to empirically test a non-falsifiable “prediction” about industrial trends given their nebulosity.
- (Paul Kluge writes a solid piece on Santova’s investment thesis).
- (BCG publication on asset-light business models)
- (The most recent WTO stats and publication)
- (This is a particularly useful article for discussing recent share price depreciation. Bad news came out in the tail end of 2019 around some lost clients, poor cash flow and increasing admin. expenses. A must read.)
- A great investment thesis from Value+ here. Their work has been very influential.
- Keith McLachlan has some great writings on Santova here.
[1] Two key sources here are Nassim Taleb’s Antifragile: Things That Gain from Disorder (2012), Mckinsey’s reports on Risk, resilience, and rebalancing in global value chains 2020 found here.
[2] See Complexity Investing here by NZS Capital for more on optimising for resilience and optionality.
[3] Resilience in Transport and Logistics 2020 found here.
[4] The benefit of advanced analytics requires substantial time and capital investments, acting as somewhat of a barrier to Santova’s competitors (source).
[5] Cf. Complexity Investing.
[6] Source: this Bain & Co article
[7] This article emphasises the large opportunity of automation for supply chain managers if done correctly. It also argues that such automation is a highly complex task. This could act as a barrier to entry for Santova’s unautomated competitors.
[8] Source: Deloitte, Accenture
[9] Source: https://www.mckinsey.com/industries/travel-logistics-and-transport-infrastructure/our-insights/us-freight-after-covid-19-a-bumpy-road-to-the-next-normal
[10] As an interesting point, have a read of Keith McLachlan’s valuation of their software platform in 2014. Essentially, he values their software around R300m in 2014. SNV has since replaced this software and the valuation is no longer directly relevant. The application of it however, is. Valuing Santova on book value is increasingly challenging due to the wat IFRS records R&D expenses and software development.
[11] https://ourworldindata.org/trade-and-globalization is a great source for data and general information on world trade over the last century.

Thanks for the update JD,
I have rebalanced my portfolio accordingly, swapped a chunck out of Curro which you had a s a ‘sell’ and into Santova,
Love your style and work!
Cheers
Steph
>
LikeLike
Thanks Steph, appreciate the vote of confidence.
I am cautious around giving any “sell/short” suggestions. I find it’s harder to know when to sell than it is to know when to buy.
A lot of very smart people disagree with me on Curro’s prospects, so it’s one of those companies I am particularly curious about.
All the best,
JD
LikeLike
Hi Jordan,
Thanks for the piece, very comprehensive. Still need to get through all of it but why are you subtracting cash from the value when it has a net debt position?
Thanks
Scott
LikeLike
Hi Scott
Thanks for the comment. Great question! The way their working capital works makes a large portion of the asset base receivables. Their payables account for a lot of their current liabilities, while the receivables outweigh the sum of the payables and their other short term debt.
It’s a tricky working capital situation, and you are right in a sense: they are in a net debt position, but considering all current debt can be settled with the difference between receivables and payables, I am comfortable removing the cash.
All considered though, it’s not a major factor for the bull case. The valuation is still pretty low on all accounts and the cash removal is only briefly mentioned as a passing remark in the valuation part of the article.
LikeLike
Hi there, You have done an incredible job. I’ll definitely digg
it and personally suggest to my friends. I am sure they’ll be benefited from this site.
LikeLike