
Introduction
This report will take on a bit of a different structure to the usual ones. The price has also changed since beginning this article in October.
Both the thesis and antitheses can be broken down into four core components1:
- Context (valuation, competitors & comparisons, and nature of industry).
- Growth (financials, duration and drivers, total addressable market, and reinvestment potential).
- Quality (management, innovation, sustainability, business resilience, and competitive advantage).
- Estimations (rough guesswork to events, execution plans and future states).
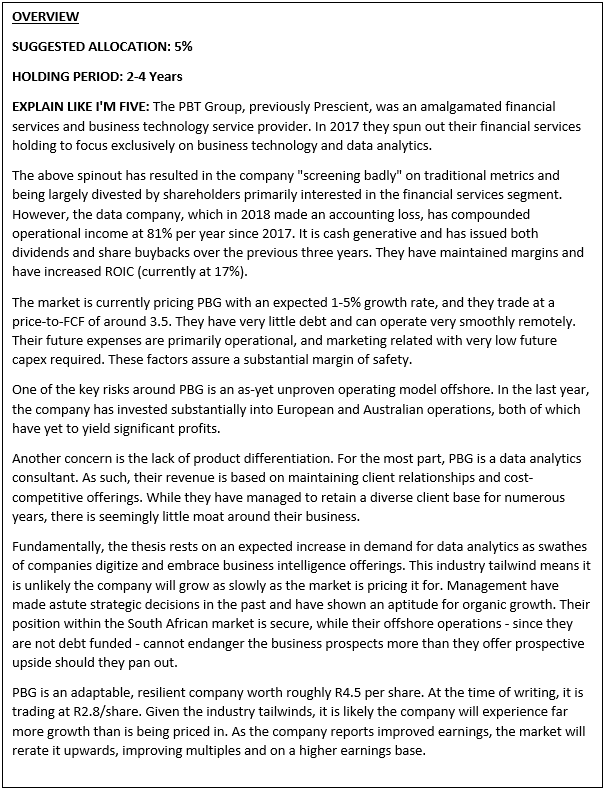
The thesis for the PBT Group (PBG) is a simple one: PBG is a high-quality and resilient business which is well positioned to capitalize on substantial industry tailwinds. It trades at a substantial margin of safety and it will grow at a rate several times that which is priced in by the market (Figure 1). There is also mild optionality in offshore expansion and increasing service range. Market realization will be catalysed as the company reports increasing growth rates.
Testing this thesis requires metrics for each of the core components of the analysis. It also requires an understanding of the implicit predictions in this thesis.
PBG is capital light, low-leverage, cash generative and it has grown revenue faster than most competitors over the last three years. Contextually, PBG outcompetes peers on traditional return-based metrics yet costs less relatively and is intrinsically priced pessimistically by the market.
All these measurements should be supported both practically in the financials of the company, and theoretically in the simple economics of the business model and industry. In order to test the thesis holistically, mention must be given to the qualitative aspects like management and culture. Laying out expectations for management and key metrics creates feedback loops by which to judge the progress of the thesis.
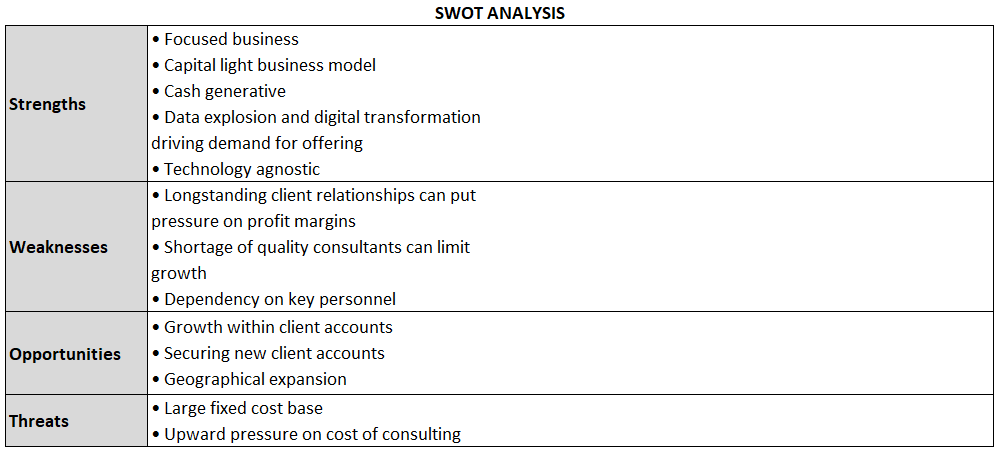
In contrast, the antitheses for PBG are numerous. These are things that could kill the business. They are also possible reasons the market is undervaluing PBG.
Internally, they have a large fixed-cost base, which – combined with the increasing cost of consulting – means continued margin squeeze. They have little product differentiation and lean mostly on relationships for sales. They are also dependent on key personnel given the relationship-based nature of consultancy. Finally, their investment offshore subjects them to international competition where they lack those relationships.
Externally, their exposure to South Africa and the discretionary spending of her financial companies means they will struggle as the country and sector do. Further, as a tech-centric company, they are subject to disruptive innovation from competitors and will need to compete to stay abreast.
Context
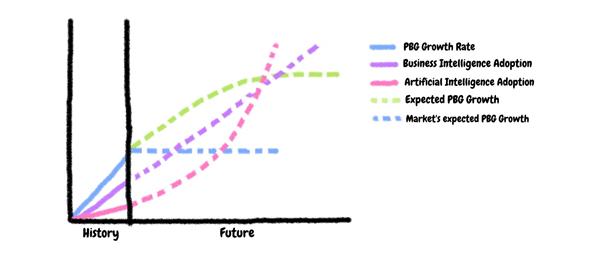
PBT’s primary services are around engineering client’s data to offer Business Intelligence (BI), Artificial Intelligence (AI), Cloud services and other analytics. Their business model would look something like Figure 2.
Data and AI are everyone’s favourite buzzwords, and not for undue reason. For the uninitiated, the data science hierarchy of needs is a useful heuristic in understanding the various parts of data use (Figure 3).

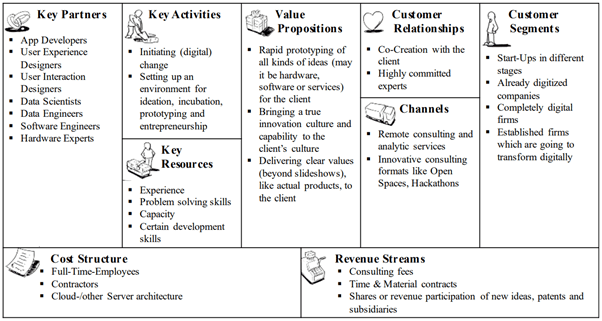
The growth expected in the data analytics industry is a key component of this thesis. It is hard to guess how fast the industry will grow, as there are several compounding factors (Figure 4). Pre-COVID, the BI market was expected to double by 2025. Given the pandemic, it is not surprising companies have adopted BI solutions rapidly for their navigational assistance. Data helps in forecasting demand, identifying potential supply-chain disruptions, and determining the effectiveness of crisis intervention strategies.
Credence Research estimates big data analytics to grow at a CAGR of 12.3% from 2019 to 2027. ARK Research estimates a CAGR of 21% between 2019 and 2037 for deep learning. The team at ARK Research are certainly biased – given their incentive to create hype around disruptive innovation – but their research is directionally correct (if a little overstated).
Figure 4 outlines the theoretical compounding of many different innovative technologies being developed. The grey elements are the estimated impact previous technologies have had globally. Note how the period 1889-1920 is characterized by the inventions “stacking” in their impact. The estimated “stacking” in today’s time is unprecedented.
The takeaway from this graph is simply that there will be incredible demand for data analytics as tech advances at its increasing rate. Data analytics underpins mobile devices, cloud computing, IoT, and artificial intelligence. It has become so valuable that arguments have been made by the World Economic Forum to include data as an entirely separate asset class.
Context: Artificial Intelligence
In brief, the data analytics industry is built on changing raw data into insights that can aid decision-making. AI requires massive inputs of organized data to train, so as AI usage grows, data management will too.
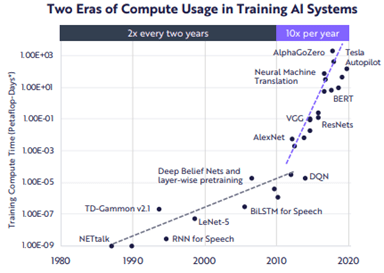
The tools required for artificial intelligence are varied. The graphs (Figures 6 and 7) below highlight the decreasing cost of several of these tools (specifically, hardware required for neural networking), and the decreasing time taken to train AI systems. The combination of these two graphs suggest a decreasing barrier to entry for AI implementation.

Andrew Ng, formerly Baidu’s Chief Scientist, has called AI the new electricity. It has also been compared to the internet in its ubiquity and importance across industries and geographies.
While the exact figures are entirely uncertain, the need for AI implementation and data analytics for companies globally is inescapable. As such, South African firms will face increasing pressure to implement data-driven decision-making systems to stay competitive.
It is easy to broadly predict that South African companies will need to spend more on AI-implementation and data analytics in years to come. It is much harder to predict narrowly that such spending will fund our thesis for PBG specifically. Further, immediate investments are likely to be curtailed and placed on hold because demand for primary services is in a COVID-19 catalysed decline.
Context: Business Intelligence & Cloud Adoption
Essentially, BI uses various methodologies, tools, and applications to enable organizations to collect data from various sources, analyse, and create reports, dashboards, and data visualizations. BI-as-a-service (which PBT does) helps organizations assess risk, reduce costs, and make better business decisions.
While banks and financial services (BFSI) companies are the main drivers of BI today, all sectors will ultimately benefit from its adoption. The growth in BI adoption across industries comes from: the growing adoption of data analytics, an increase in data generation, increased adoption of cloud business intelligence (BI) by SMEs, and the improved efficiency of BI tools.
Globally, Africa lags the developed world substantially in BI adoption (Figure 7). Locally, it is a fragmented market (partially because of its commoditized nature) making market gain easier for PBT group. Interestingly, small companies are primary drivers of the demand for these technologies.
Because of Africa’s sluggish adoption, PBG’s heavy exposure to SA (88% of revenue) is a concern. If the local economy falters (as expected), their clients (68% financial services) will tighten the purse strings and drop revenue for PBG.
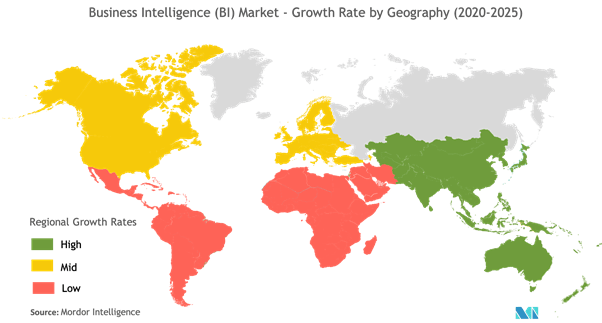
Figure 7: Global growth rates for Business Intelligence services (2020-2025E).
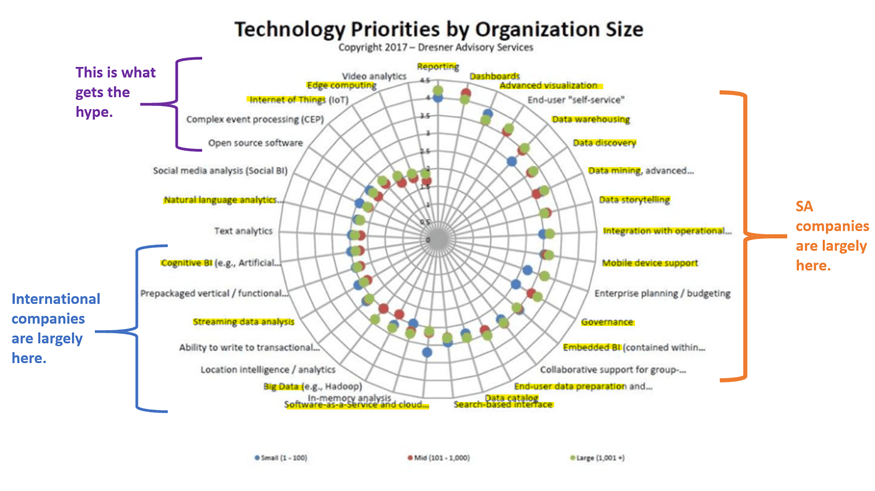
Cloud use (a massive data generator) is already entrenched in many businesses. With more people working remotely, productivity data is increasingly important to track. As far as BI adoption goes, Africa has a way to go before it competes with the global players. Fortunately, PBG’s offerings are largely aligned with the needs of SA’s lagging adopters. Figure 8 below outlines rough tech priorities for companies on a scale from 0-5, with 5 being the most important to adopt. The skills highlighted in yellow are those PBT has exemplar cases on.
Context: Competitors
While a rising tide lifts all ships, some ships are better positioned to capitalize on the rising tide. The IT industry’s inherent characteristics–including low barriers to entry, a wide variety of market segments, and large numbers of buyer groups–have made it difficult for a few players to dominate the market. For these reasons, PBT’s focus on data-based insights and consultancy make it more appealing than the local IT product resellers.
Broadly speaking, the consultancy model subjects PBT to clients cutting their discretionary spending during downturns, but also offers opportunity for integrating themselves into client operations (recurrent revenue) while accessing higher margin projects than the IT outsourcing models.
In terms of valuation, PBG is priced towards the lower end of its peer bracket (both local and international – Figure 9). In the figure below the light grey are offshore listed companies, and the dark grey are SA competitors. These local competitors are close approximations servicing the IT sector. They are not data specialists and therefore are only of limited use in comparison.

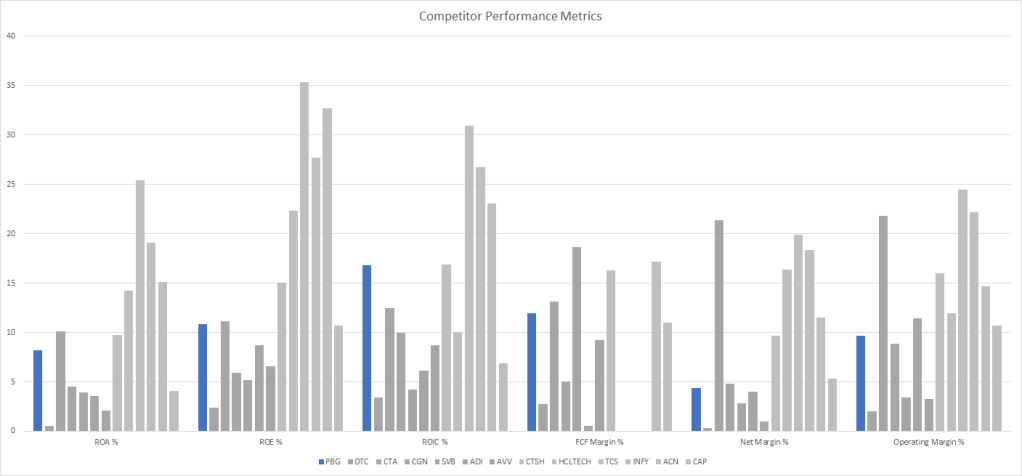
Where PBG really shines however, is in their returns and margins comparison (Figure 10). They outperform all SA peers (with the exception of CTA, who are not in data specifically) in all return metrics, while maintaining higher margins as well.
Relative to international peers, PBG lags in both margins and returns. Whether this is suggests they may improve returns and margins as the local industry develops, or whether this suggests that international companies simply have better business models is uncertain.
Given COVID-19’s normalizing of remote working and the tech-centric nature of the industry, international firms may increasingly compete in the local landscape. However, they have less relational capital than local firms and may struggle initially to gain market share. International firms will also struggle to compete on cost because of the high exchange rate.
Competitively, several key threats are outlined below in Figure 11.

The financial services industry is prone to disruption. Not only is PBG subject to innovative competitors, but most of its clients are under similar threat. As long as PBG continues to innovate and adopt best practice tech, they buy themselves time against disruption. The downside of this is that it mandates continual investment into upskilling the employee base and does not constitute an orthodox “moat”.
Context: Valuation
The final element of a contextual analysis is valuation. The below Figure 12 shows roughly how the market is pricing PBG relative to its potential futures. The worst-, base-, and best-case scenarios are shown below, each with a 20%, 30%, and 20% chance of occurrence, respectively. There is also a 30% chance of total loss.
The DCFs use a discount rate of 20% (conservative, given the current levels of stimulus and low bond yields). The best-case assumes a 15% growth rate, base – 5% and worst – 1%. The base case assumes zero profitability in 2021, and the worst, 2021 and 2022. These assumptions likely skew the valuation downwards.
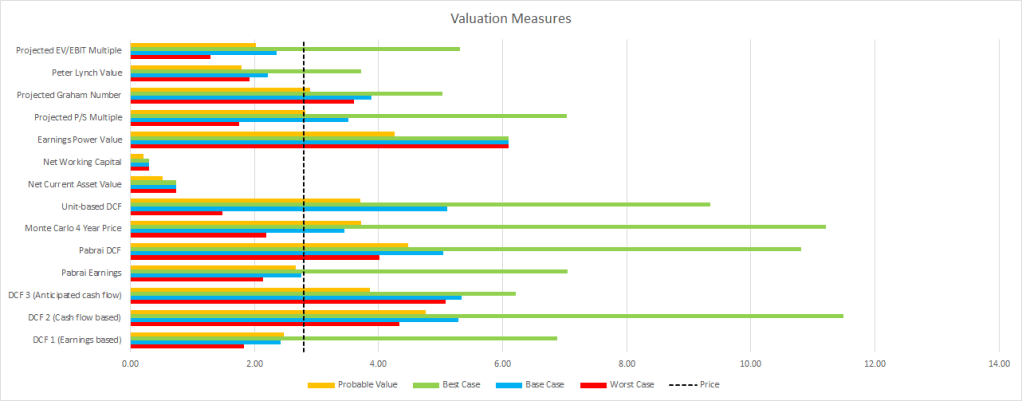
The thesis of this article is that because of the substantial demand and industry tailwinds, PBG will grow earnings at more than 10% per year, outperforming market expectations and catalysing investor demand. This will both rerate its trading multiple and increase its earnings base. As far as downside goes, the share price hovered around R1.1 in 2018 – this is likely the trough of investor pessimism and may be considered a floor.
Unfortunately, the concentrated shareholder ownership leaves little free float for the company. Spreads are high and it is challenging for new shareholders to take or sell positions. This will remain as is until the company has grown into substantial investor interest.
Assuming zero growth within three years, PBG will make their present market cap back in free cash flow. Combined with the heavy industry tailwinds, this represents a substantial margin of safety.
Growth
Growth: Financials
Having undergone a period of restructuring, the PBT group is far leaner than it was previously. Over the past three years, the company has disposed of Prescient – its financial services arm – and exited its Africa and Middle East operations. The leaner company has grown handsomely in the past 18 months and is likely to continue its current trend (Figure 13). Additionally, revenue grew 20% and free cash flow more than tripled.
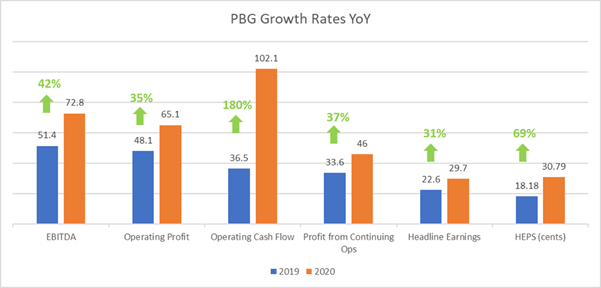
While 2020 was a bumper year for the company, many of these growth rates may be inflated given the complex accounting adjustments made post-restructuring. The demerger in 2017 with Prescient and the subsequent discontinuation of their loss-making Middle East and African operations make it challenging to see how their data business has done.
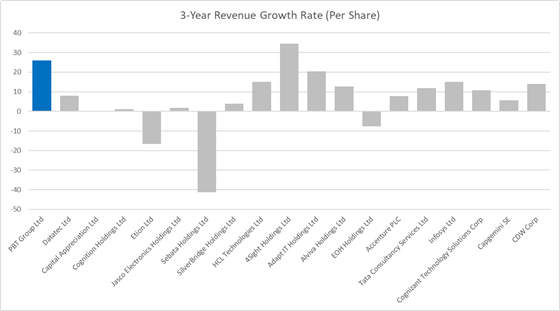
One growth metric not affected by the restructuring is revenue per share: PBG has grown faster than most competitors at a 26% CAGR per year since 2017 (Figure 14). This is mostly because of the decrease in shares outstanding from 149m to 96m over the last three years.
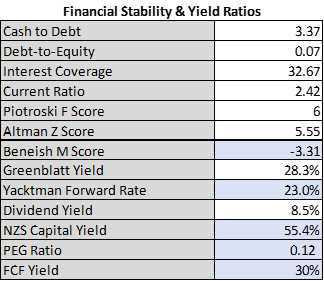
Currently, Figure 15 below outlines a very resilient financing structure for PBG. They have low debt and plenty of buffer in their balance sheet. The various scores (explained here) suggest a very stable position, while the yields and forward rates (heuristics designed to approximate future returns without predictions) all indicate a very positive outlook. Finally, their (altered) PEG ratio suggests substantial underpricing relative to growth shown – in this case, operating income rather than earnings was used for the PEG calculation as it more accurately reflects the growth of the business.
They have had a very complex series of earnings since their disposal of Prescient. In 2018, the group lost R139m partly due to an R127m accounting write down of goodwill and several restructurings. The company did receive a similar amount in cash however, so it was largely an accounting adjustment. Figure 16 outlines the company’s earnings quality over the three years since disposal. Despite volatility in earnings, cash flow has been consistently strong.

Growth: Drivers and Duration
Assuming that:
- AI requires data engineering for training,
- AI, BI and cloud services will be increasingly adopted,
- Data generation will increase with time,
It stands to reason that PBG’s services will continue to be in demand for the next couple of years at least.
Further, assuming that:
- Both the global and local data services markets are fragmented.
- PBG offers competitive products with local and international firms,
- PBG continues to rank well on customer satisfaction and gains repeat orders.
It stands to reason again that PBG will continue to either maintain or grow their share of the market. In both instances, they grow revenue at or above the rate of broader industry growth, both of which are higher than the growth currently priced into the valuation.
For the broader industry, three factors are driving the adoption of AI: faster processor performance, larger data sets and more sophisticated neural nets (Figure 17 below).

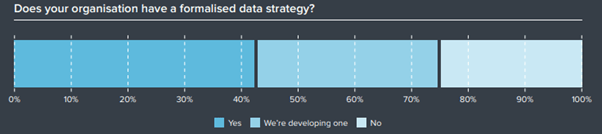
The drivers for BI adoption are primarily competitiveness and the operational efficiencies it can bring; however, governance is also playing an increasing role.2 Companies are increasingly aware of the need for BI and data engineering: per Figure 18 below, 30% of local companies are in the process of adopting a formalized data strategy.
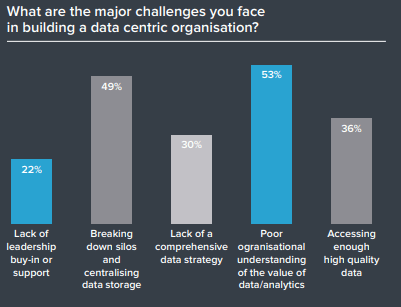
Most challenges to data centricity are organizational: siloed structures or poor understanding. Notably, leadership buy-in is comparatively not an issue (Figure 19). The top-down push for increased adoption as a strategic goal means sustained interest from local companies, despite the organizational challenges.
A growth node identified by the company is their expansion into Europe (4% of revenue) and Australia (8%). They have largely finished the investment there and are expecting to realize increased profit from these areas. The European office increased revenue by 137% over the year but was still loss making given the set-up costs. The Australian division lost 16% of its revenue, but increased profitability by 38%. Both divisions are ungeared and have strong cash positions. While these segments provide SA investors with a small ZAR hedge, they also expose the company to increased pressure from international firms. In the offshore divisions, PBG would have less relational capital and would likely be at a disadvantage to firms local to AUS and EUR.
COVID-19’s digitization has also spurred on the adoption of cloud and data analytics worldwide, so all segments are expected to benefit from the increased demand.
Growth: Product Differentiation
Differentiation in the data and consultancy services industry is mostly relationship and cost based. PBG has case studies from 20 years of service to large-cap SA clients, and draw 81% of their revenue from time and material contracts. This suggests a well-entrenched position within existing clients. Sales to new clients will be a challenge, however the demand tailwinds make it likely they will grow satisfactorily without a typical “moat” to their product offering.
For those not familiar with the various consultancy project models, Figure 20 below outlines the difference between fixed contracts and time & materials contracts.

Dividing the 81% of PBG’s revenue that comes from time and material contracts amongst their 640-person employee base and assuming 2150 hours of work per person per year at 100% billability gives one an average fee per hour of R395.
In reality, they likely charge around R250/hour for a junior consultant and upwards of R1000 for a senior one. This is roughly the same as the rest of the local industry. International firms charging in USD are substantially more expensive and so likely will not put too much pressure on SA competitors (Figure 21).
| Global Hourly Rate (USD) | Local Hourly Rate (ZAR) | PBT’s Hourly Rate (ZAR) | |
| Data Engineering | 200-350 | 280-500 | 395 |
| Analytics & Visualization | 150-275 | 250-550 | 395 |
| Cloud Services | 60-78 | 610 | 395 |
| Artificial Intelligence | 250-350 | 250-850 | 395 |
| Managed Solutions | 90-150 | 450-1000 | 395 |
This is the area the company falls the shortest. There is little clear product differentiation, they depend on relational capital and risk some client loss should their key people leave. Like most consultancies, they need to continuously hire top quality talent and invest heavily into their employees. This makes employee churn a costly risk and limits their scalability.
Growth: Total Addressable Market (TAM) & Reinvestment Potential
Estimating PBG’s TAM is challenging given their unsegmented reporting. The only way to know how much revenue they get from each area they operate in is to guess.
| Current Global TAM (ZAR) | Est. Industry 5Y Growth Rate | Sources for Estimates | |
| Data Engineering | 825 000 000 000 | 18.20% | Source |
| Analytics & Visualisation | 379 500 000 000 | 7.5% | Source |
| Cloud Services | 4 455 000 000 000 | 16.40% | Source |
| Artificial Intelligence | 643 500 000 000 | 42.20% | Source |
| Managed Solutions | 3 300 000 000 000 | 12.50% | Source |
Roughly assuming South Africa comprises 0.5-1% of the global market for each industry and assuming PBG captures between 1-5% of the SA market, their TAM today could be anywhere from R480 million to R2.4 billion. Using the industry growth rates in Figure 22 suggests a TAM in 2025 of between R1.08 billion to R5.4 billion.
Given that their current revenue is R673 million, it is likely that they capture around 2% of the SA market, where the SA market is around 0.5% of the global market. Weighting their revenue sources per the global market size of each industry and extrapolating their current market share with the projected industry growth rates suggests a 2025E revenue of R2.2 billion, for a CAGR of 27%.
This projection need not be specific, only directionally accurate.
This year, PBG’s return on invested capital increased to 17%. Their breadth of verticals, the developing nature of the data industry and their tech agnosticism all mean they have high education expense requirements. Reinvestment will primarily be into upskilling staff and training new employees. Because theirs is not a product or platform service, the scalability and ability to compound at this 17% ROIC is limited.
Quality and Expectations
Quality is a notoriously difficult thing to measure. While the thesis for PBG is more about a demand and growth mispricing, it is still important to consider the company’s quality. This worksheet uses Koon Boon Kee’s HERO framework and applies it to PBT. The company scored 66% overall on a butchered rendition of the framework.
In Thorndike’s book The Outsiders he says a trait of quality management is quality capital allocation. PBG’s current ROIC is 17%. Well above average for the JSE market. Figure 23 below – from PBG’s latest results presentation – shows the capital allocation approach PBG took in returning value to shareholders. Over the last year they repurchased undervalued shares, distributed a dividend and experienced a 22% rise in share price. With around 42% of the company being owned by insiders, the inclusion of this slide in their presentation parallels their alignment to shareholder interests.

Further, the company recently promoted Elizna Read and Bianca Pieters to CEO and CFO, respectively. This is good to see, both because it means more women in the upper echelons of management, and because they have both been at PBT for a long time (Read for 20 years, and Pieters for 10). The prior CEO and CFO are both remaining available as consultants.3
Unfortunately, the company has little-to-no competitive advantage or “moat” barring some relational capital. Their service is not too differentiated from other data-based consultancies. The balance sheet is very conservative, they are very cash generative, and their services are likely to be in strong demand over the coming years. They are a reliably resilient business.
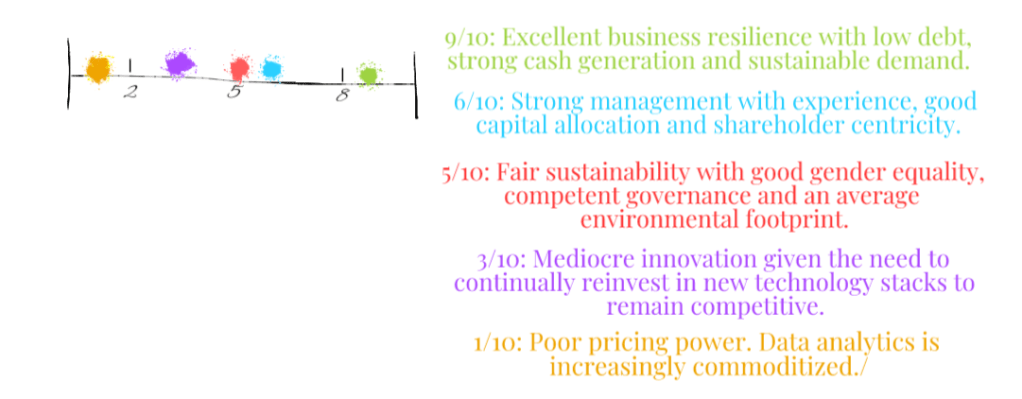
Most metrics used for quality are subjective. Being conservative, Figure 24 gives estimates of PBG’s quality across several metrics. Anecdotally, employees have very positive experiences working there, citing competitive reimbursement as one of the many pros. That said, employee costs minus stock-based compensation (mostly given to the newly appointed chiefs) only rose +3% y-o-y. This is under inflation and could mean lower salary advancement than competitors.
Feedback from clients regarding service also appear positive. As this is the bread and butter of consultancies, it is worth taking some time to read the case studies PBT has on their past work. Find links to the SA branch here and the AUS branch here.
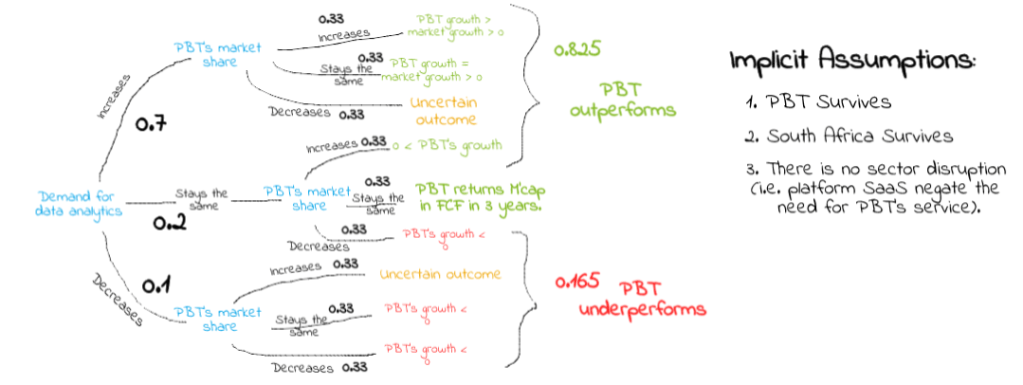
The expectations and rough probabilities underpinning this thesis are can be roughly laid out in the decision-tree below (Figure 25).
To monitor the thesis, specific expected feedback loops could be along the lines of:
- Offshore segment profitability and expansion. Management should market-test expansion possibilities with (hopefully) rapid feedback loops.
- Maintained ROIC > 15%. With the fresh CEO/CFO promotions, capital allocation will be a key metric to watch.
- Increased revenue per employee and increased employee count. This ensures both growth in broader business and a progression into higher margin bespoke projects rather than an out-the-box reseller model.
- New projects at new clients suggests a gain in market share. New work at existing clients suggests entrenched relational capital.
A Comment on Mental Models
Charlie Munger is fond of sieving investments through his mental latticework. While there are thousands of various models out there, some useful ones for this case study are:
“All I Want To Know Is Where I’m Going To Die So I’ll Never Go There”: A quote by Munger and not exactly a “mental model”. The idea is here to remind the investor to avoid common pitfalls and blow-up risk. Many people “die” through overleveraging (be it operating or financial), value traps, overweighting narrow-prediction bets, overlooking governance issues and straying outside their circle of competence. In this instance, PBT displays none of these.
Supply, Demand and Elasticity: One of the foundational economic models, this explains the level of prices through the relationship of aggregate demand/supply. Given that the thesis here is basically underpriced structural demand tailwinds, it makes sense to understand this model. Typically, when demand exceeds supply, supply increases or prices rise until demand falls. How fast demand will fall will depend on the “elasticity” of the good – its responsiveness to change in prices.
PBT’s good is relatively elastic, so they cannot afford to push prices too high. Additionally, there is not really a structural limit on supply (i.e. no moat). The implication here is that this thesis is an opportunity arbitrage. Over the short-medium term, supply will rise, and as new players enter the market.
Anchoring, Sunk Costs, Confirmation Bias, and a Noise Bottleneck: These are all various behavioural heuristics/biases which may be present in this article. I began researching when PBT was ~R2/share. My writing has been anchored to that lower price. Writing also carries sunk costs – I could become attached to a bad idea, just because I spent a lot of time thinking about it. Given that the research into the data engineering field was done to better understand PBT, it likely carries confirmation bias as well. Finally, the extensive research process may have been unnecessarily lengthy, causing a “noise bottleneck” as coined by Taleb – losing focus on what matters because it is accompanied by a whole lot of unimportant stuff.
Lollapalooza: Another Munger-ism, used to identify instances where many models come together for a compounding effect where the whole is more than the sum of its parts by a large margin. There is not sufficient evidence to suggest PBT is a lollapalooza-experiencing company. It appears to be a linear bet rather than a potential convex-upside type.
Conclusion
In short, PBT Group is a well-run, cash generative company, where employees enjoy working, in which management have a substantial stake and which will benefit from significant industry tailwinds. At present value, the market is under-pricing PBT’s future growth by a substantial margin. This fact forms the basis of the investment thesis.
The company does not have much pricing power and is subject to increasing competition (especially in its offshore ventures) yet has shown strong growth in recent years and has a balance sheet resilient enough to weather short term fluctuations.
The company shows no major red flags. It is unlikely to be a value trap given its industry & growth rates and it has no suspicious accounting irregularities despite the recent disposal of Prescient & Middle East/Africa operations. Management are also aligned and have opted to use little leverage.
For these reasons, the company offers a lopsided bet over the medium term, with limited downside given the currently low valuation, high cash generation and focus on returning value to shareholders.
1) Thanks to NZS Capital for the framework.
2) For examples of how data analytics are used in a variety of industries, see this source.
3) Here is an interview with Read for those who want to get a feel for what she is like. She seems like a humble, friendly person.
